Right after graduation and over the summer of 2021, I worked towards this Data Analytics certificate as I wanted to broaden my skill set. Coding and Data Analysis always intrigued me and I decided to deepen my knowledge so that I could one day use it in the Petroleum Engineering industry. This Repository coresponds to all the projects I did in Python and R to complete my certificate.
Below is a Summary of the aim and results of the various projects I completed. The complete description and lines of code are located inside this repository and are linked in this summary.
-
Identify types of business problems for which data analysis can provide significant insights in support of business decision-making.
-
Translate business objectives into analytical opportunities using data mining.
-
Select and justify appropriate types of data analysis and statistical procedures
-
Apply data analytics in eCommerce (e.g., understanding customer behavior, segmenting customers by key demographic factors, selecting new products strategically and predicting their profitability).
-
Become broadly competent in the use and evaluation of statistical machine learning techniques of classification, regression and association.
-
Apply dimensionality reduction methods to broad datasets to reduce their complexity prior to modelling
-
Identify and solve collinearity through feature engineering and feature selection
-
Interpret the results of data analysis to make models and predictions and to establish the reliability of those predictions.
-
Acquire, process, and analyze extremely large data sets using cloud-based data mining methods to discover patterns or do data exploration.
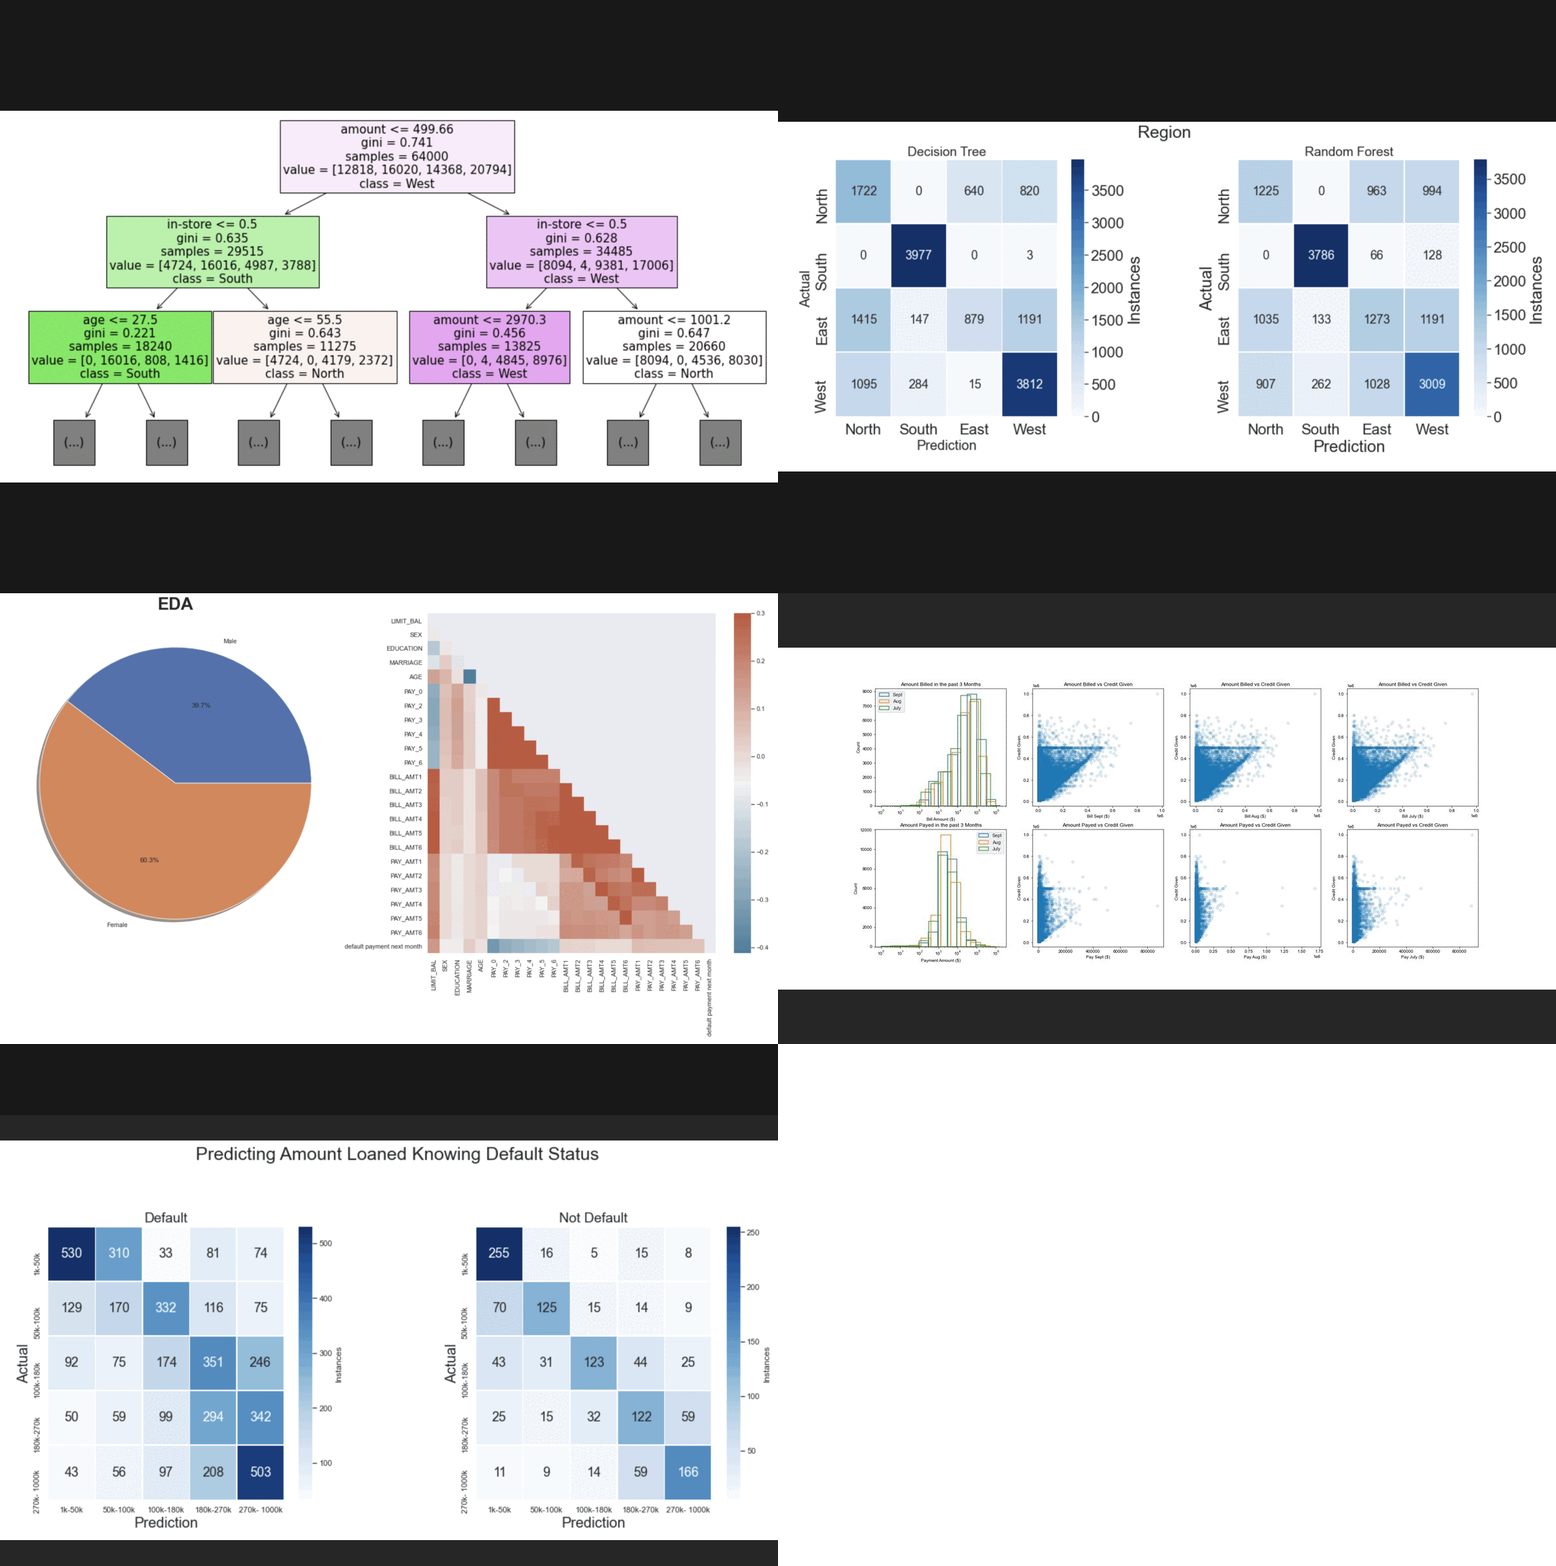
Utilized pandas profiling and other EDA methods for initial analysis.
Used Decision Tree & Random Forest algorithms to create regression and classification models. Created Correlations & Confusion Matrix to visualize predictions.
All Code ,
Project Report , &
Decision Tree visualization
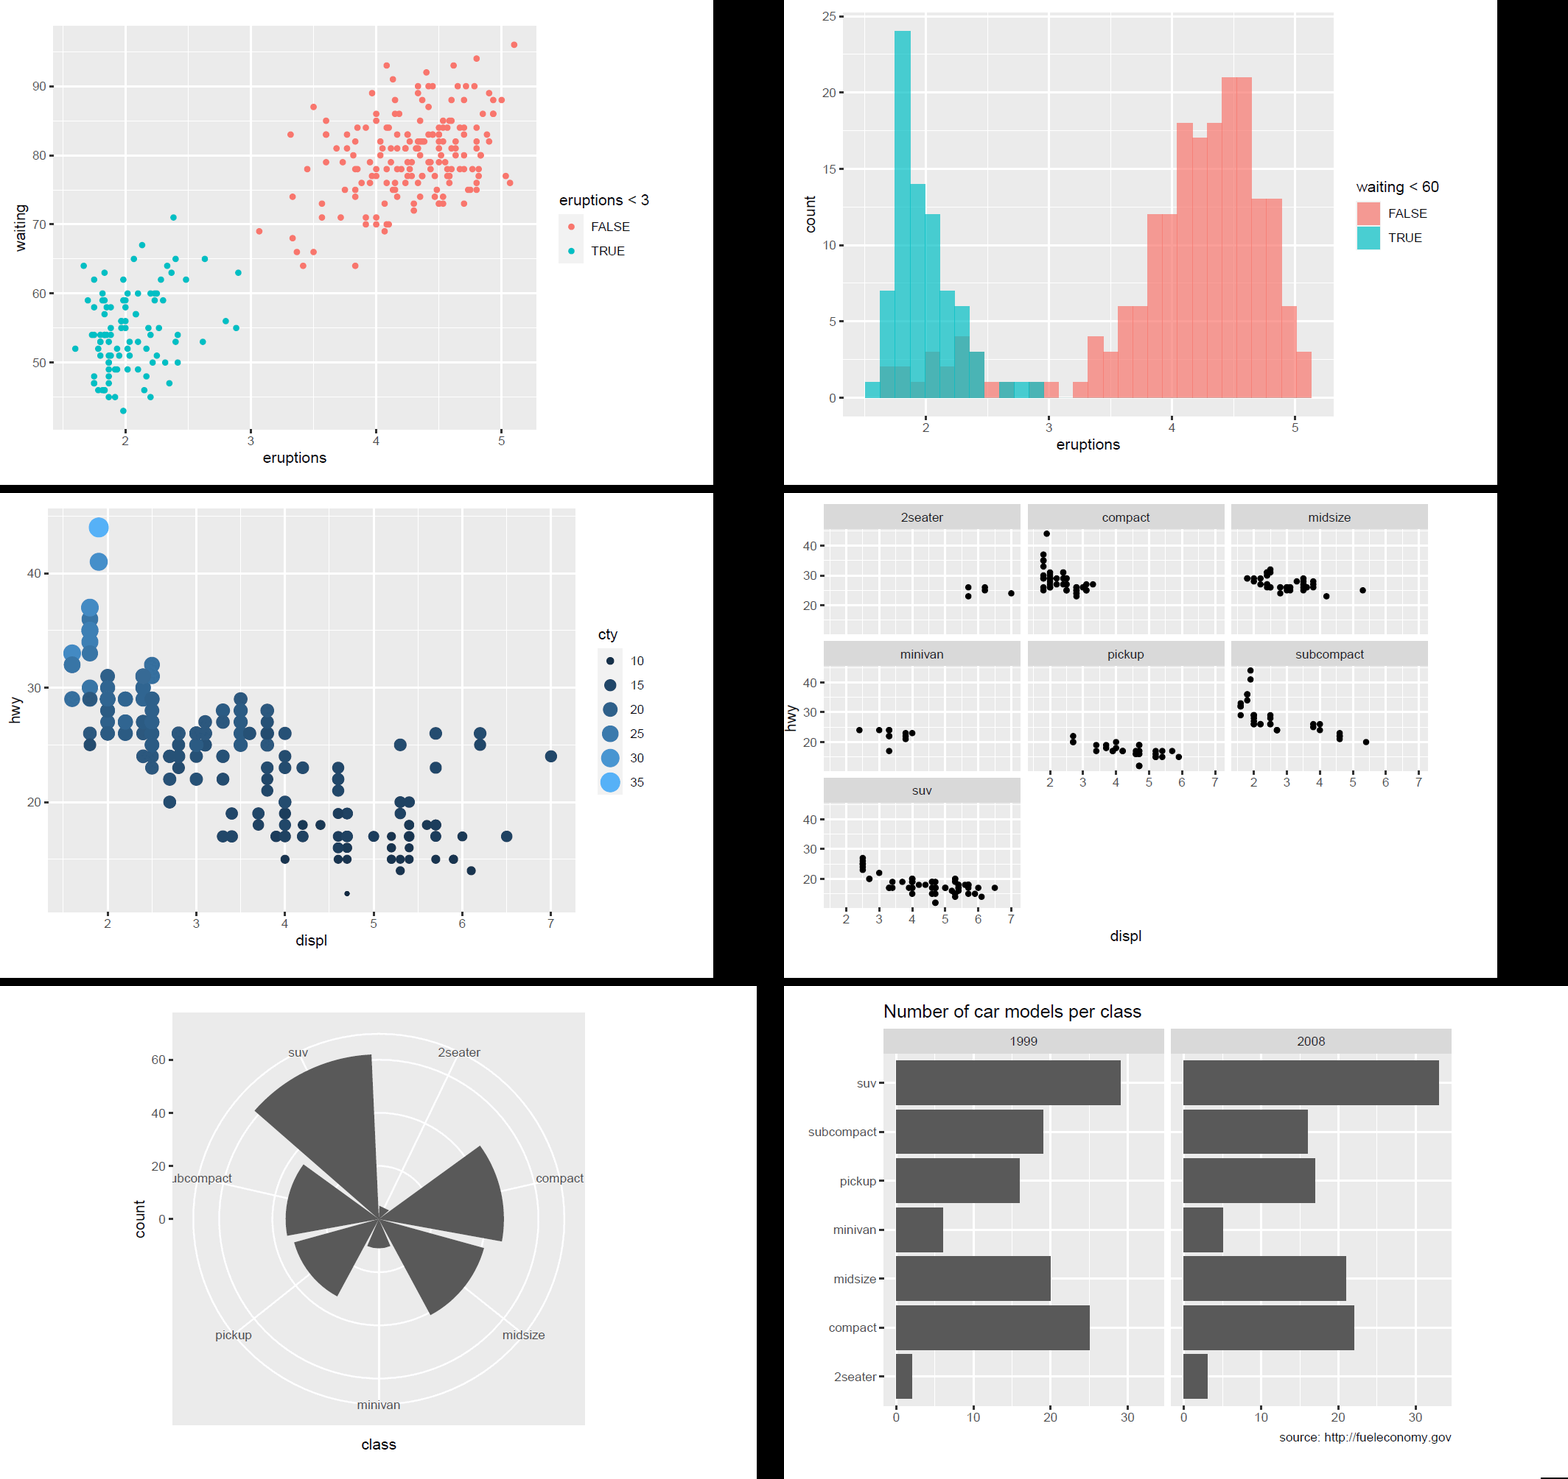
Learned fundamentals and theory behind GGplot and multiple graph styles for future uses.
All Code and
PDF Report
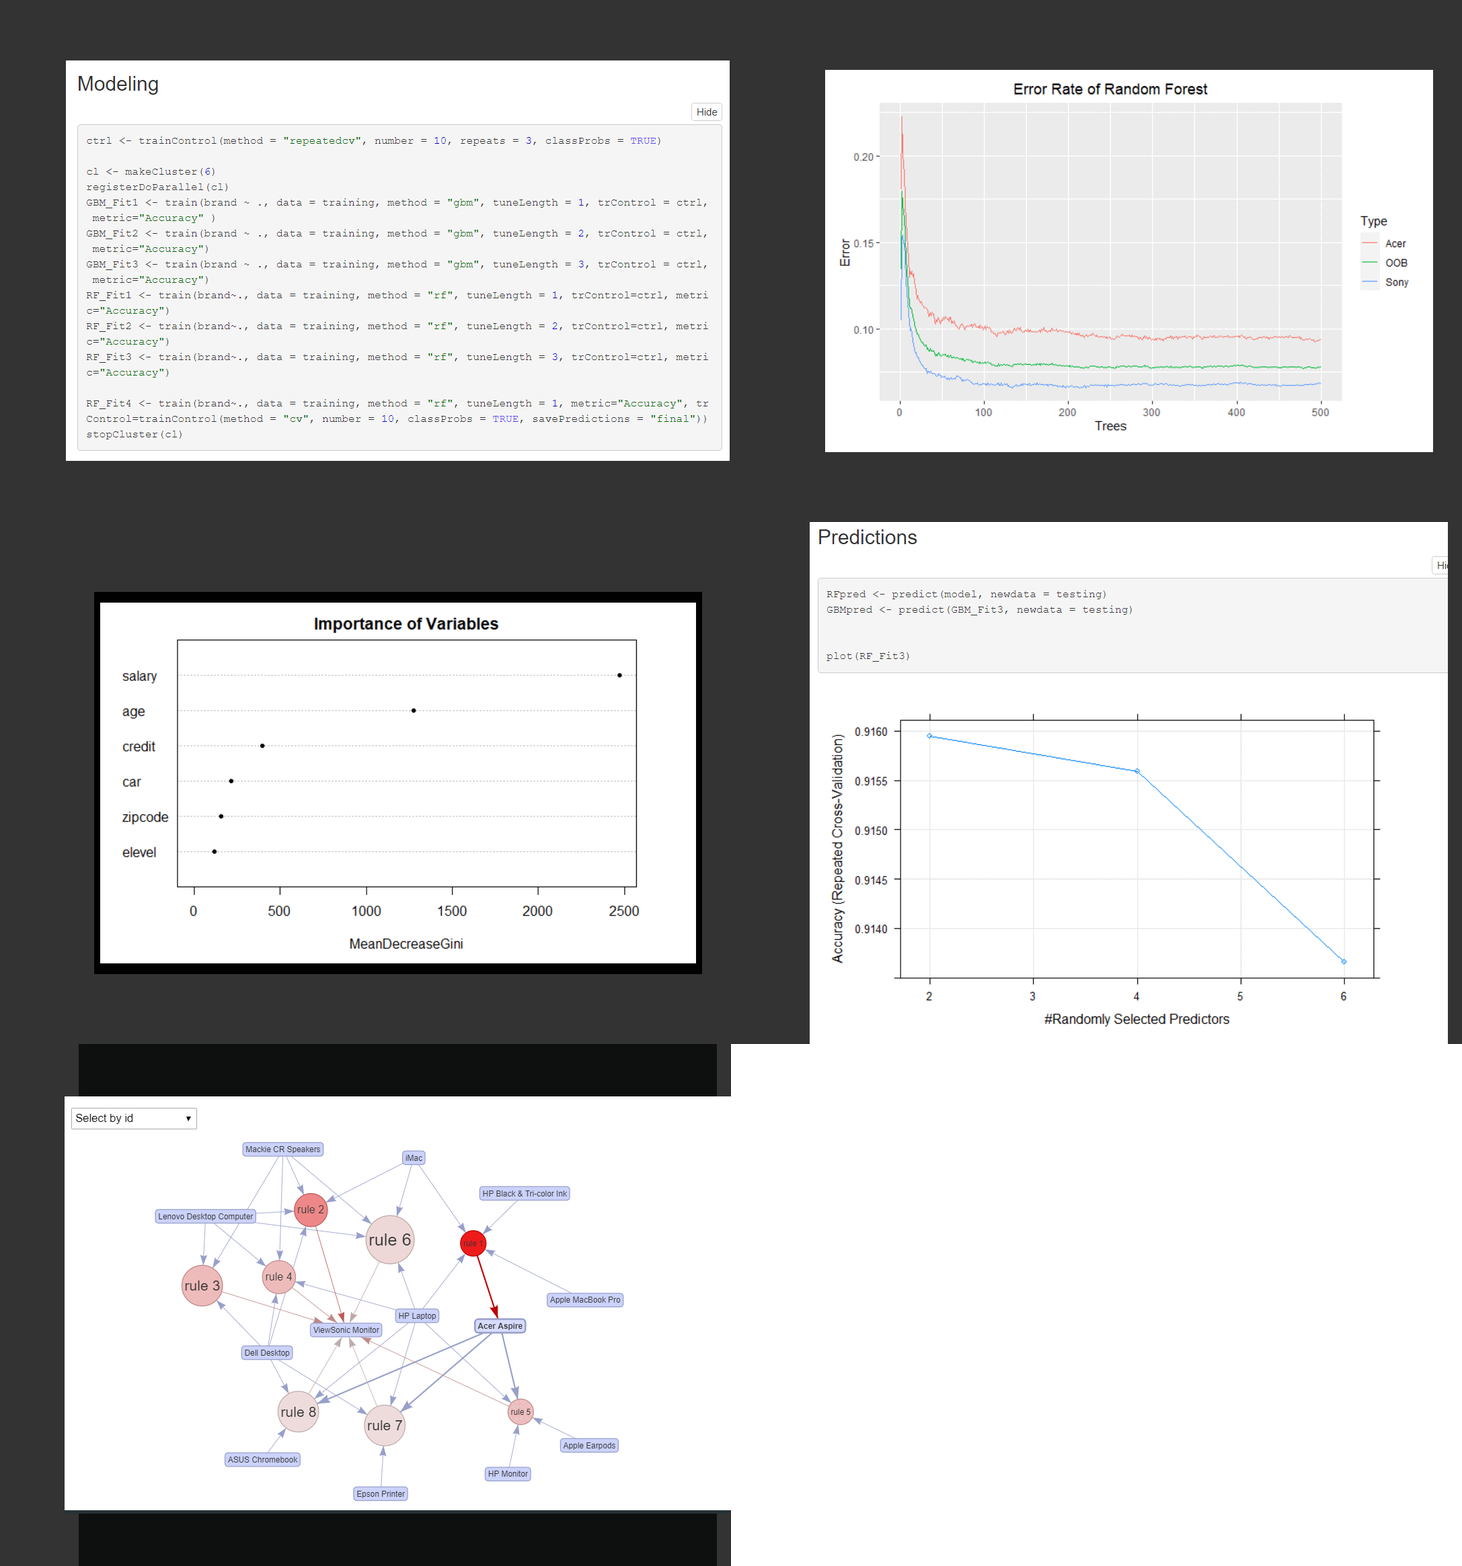
Used pacman to import essential libraries into R. Learn to train and test Random Forest models with different set of parameters. Found Variable importance and error rate of my model. Created and visualized rules for a market basket analysis.
Familiarizing myself with R, Modelling Customer Preferences, Sales Data Anlysis, Basket Analysis.
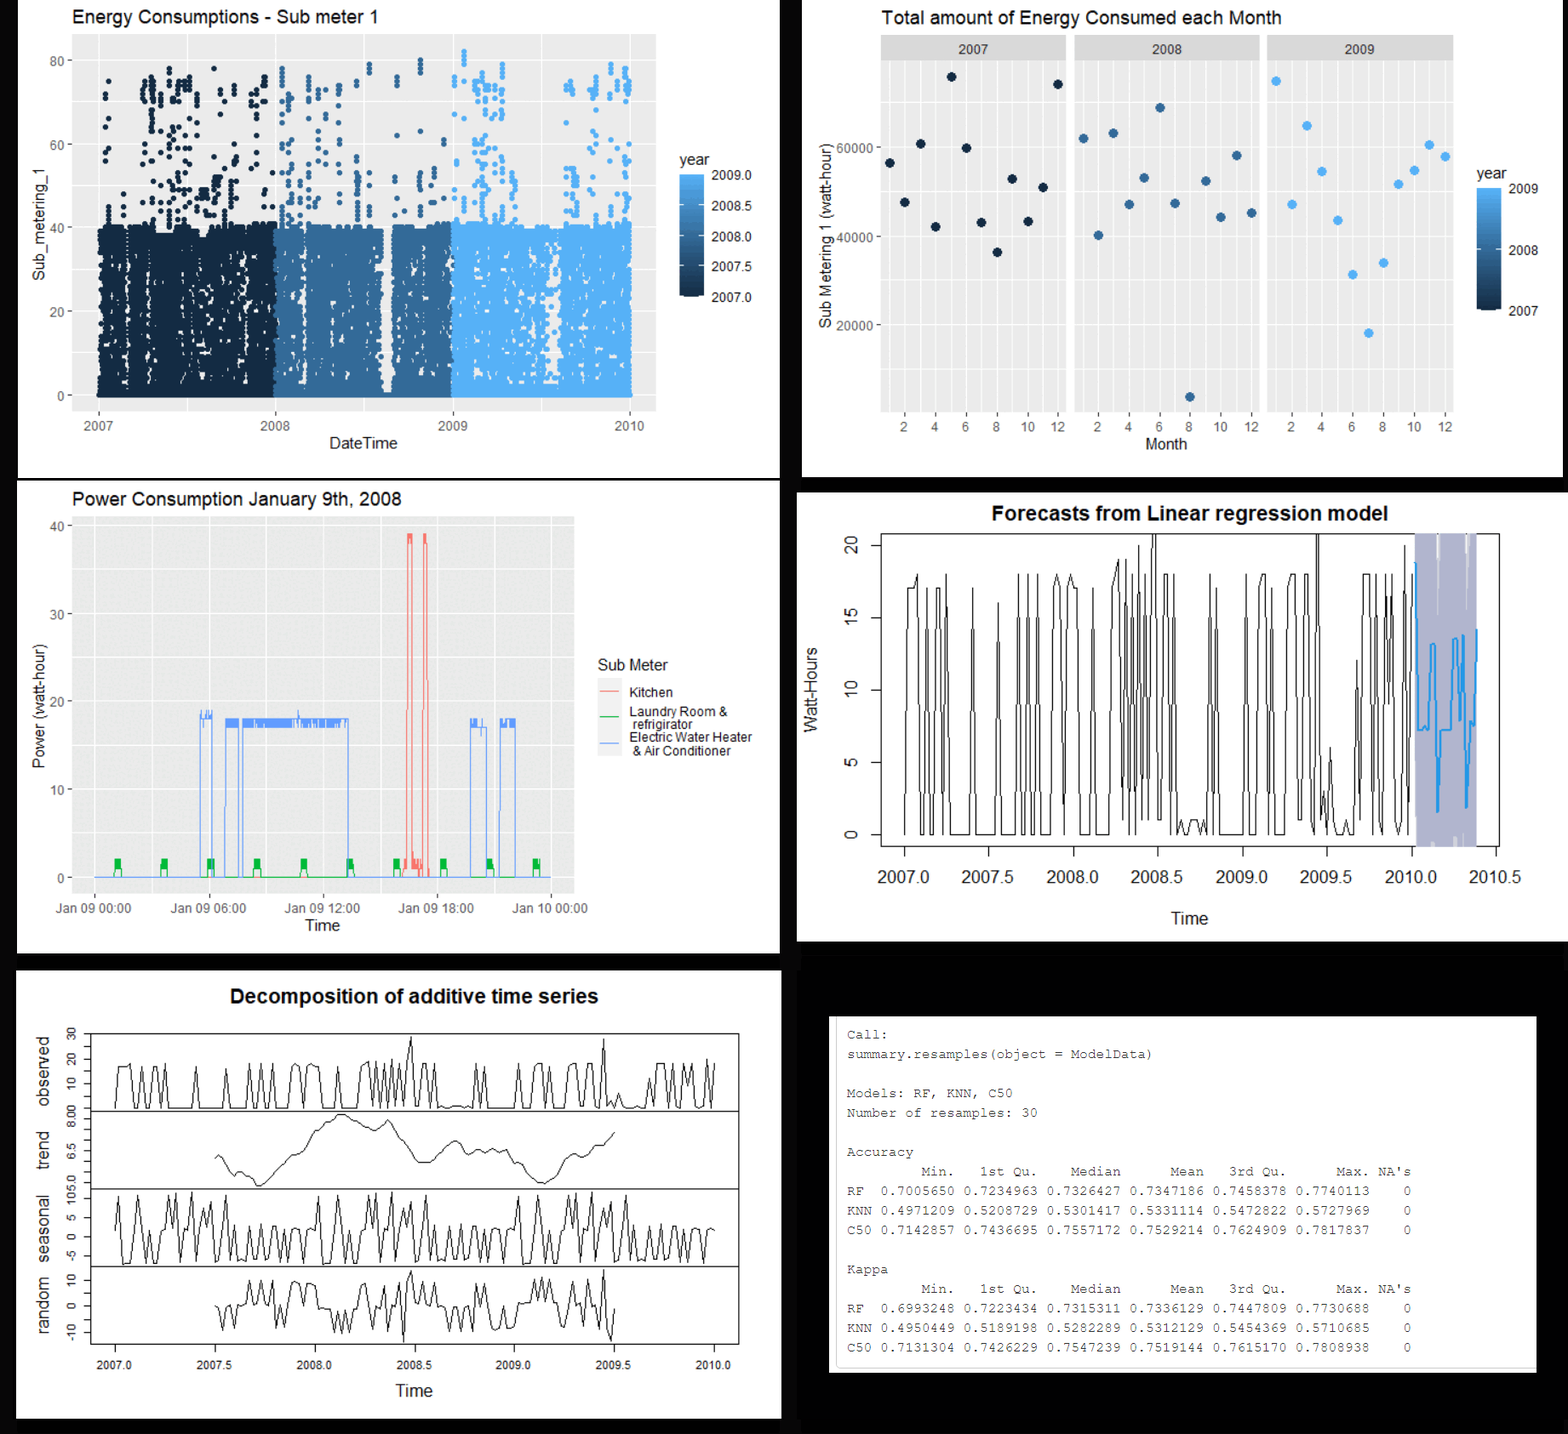
Modeled patterns of energy usage by time of day and day of the year for residential aptms. Performed an 'analytical deep dive' of sub-metering generated data and producing high quality visualizations. Determined a person’s physical position in a multi-building indoor space using wifi fingerprinting.
Sub-metering Analysis Code & PPT Report, Wifi Fingerprinting Code & Report
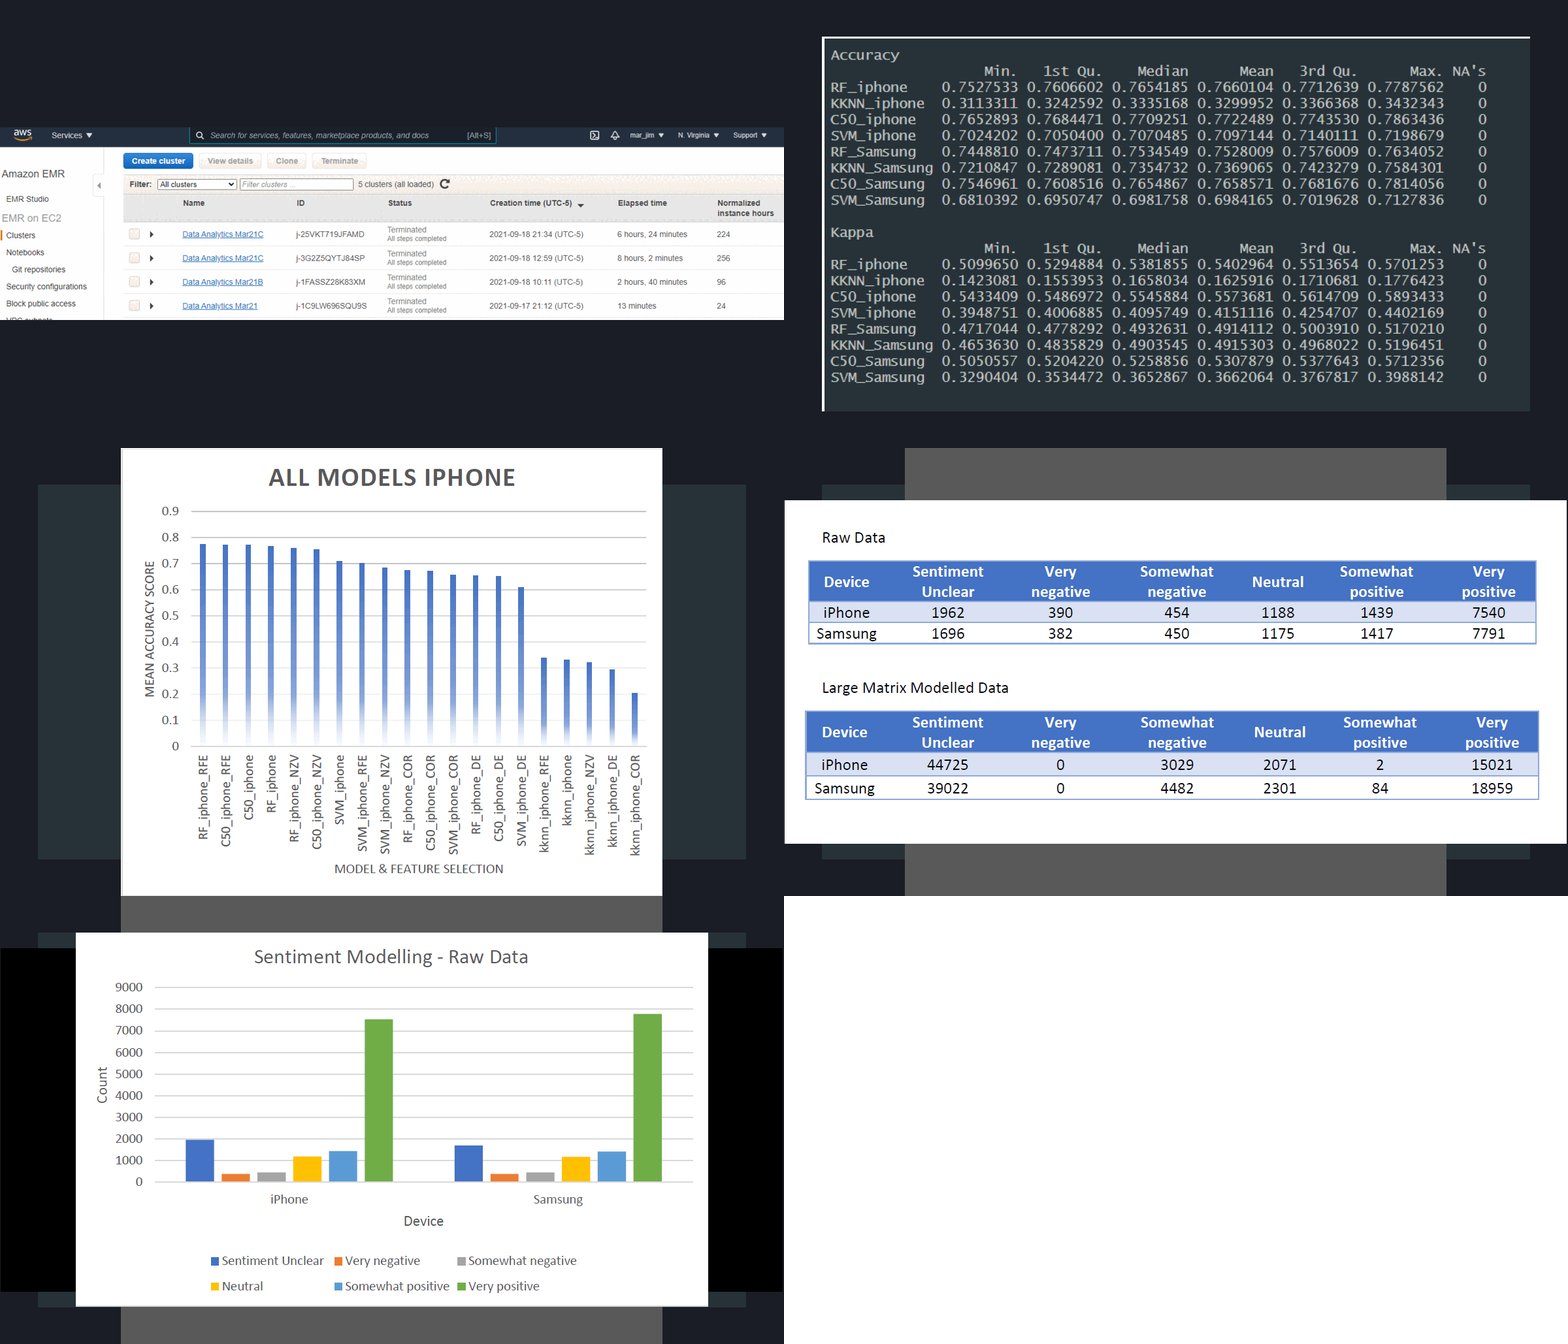
Master fundamentals of scaling up data analysis to a large cloud computing platform (AWS). Worked with map-reduce-based systems and leveraged the computing power of the cloud to prepare very large data sets for analysis. The code reflects the data modelling of a small sample data, used to then work with the enourmous data matrix created from cloud computing.
All Code, PDF of Code, & Report
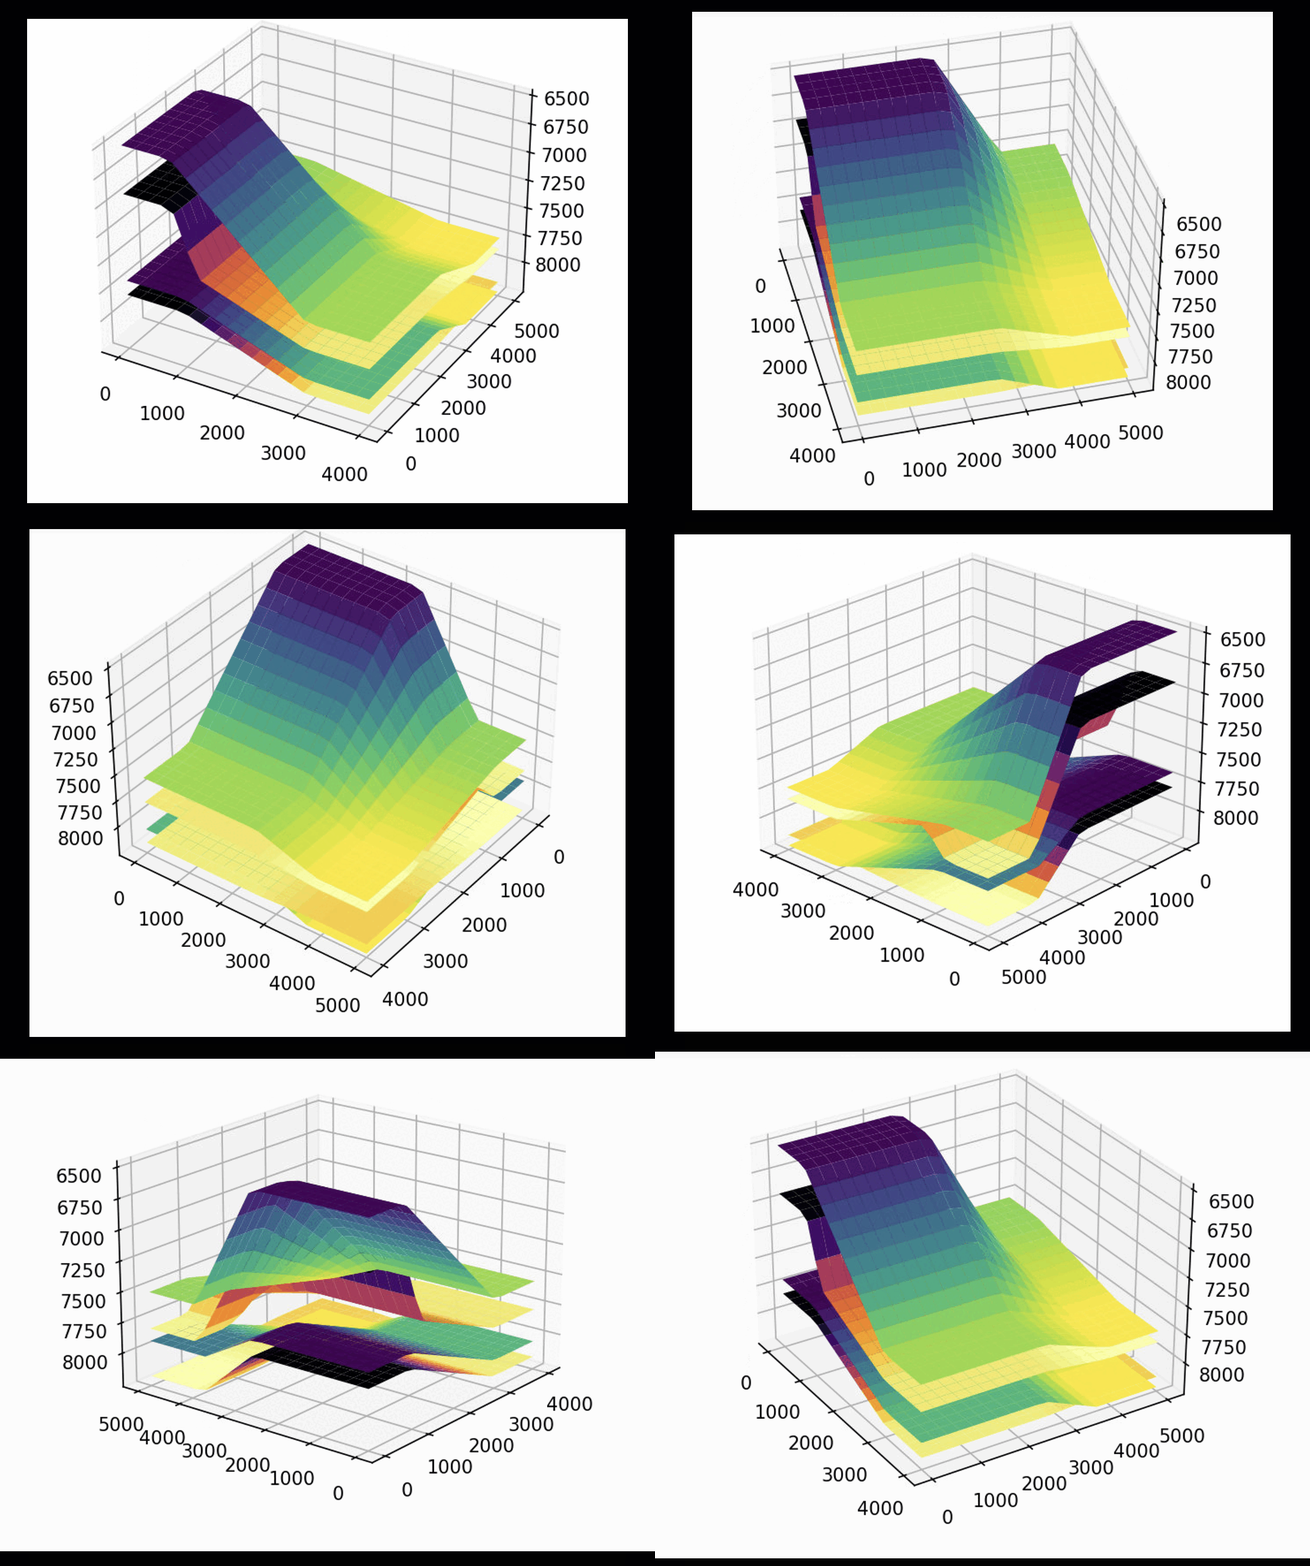
To the right is the reservoir subsurface model I created for our Senior Design project. It models Oil-bearing sands in the South Texas Frio reservior. They are truncated sands against a salt dome & trapped by overlying Anahuac Shale.
| Course 1 Examining Customer Demographics |
Course 2 Predicting Customer Preferences |
Course 3 Data Analysis and Visualization |
Course 4 Data Science & Big Data |
|---|---|---|---|
| Python | R | R | AWS & R |
| 1) Perform Exploratory Data Analysis on customer demographics data using numpy, pandas, seaborn, and matplotlib. 2) Identify which customer attributes relate significantly to customer default rates and to build a predictive model that the business can use to classify potential customers ‘at-risk’. |
1) Use machine learning methods to predict which brand of computer products customers prefer based on customer demographics. 2) Determine associations between products that can be used to drive sales-oriented initiatives. |
1) Modeling patterns of energy usage by time of day and day of the year in a typical residence whose electrical system is monitored by multiple sub-meters. 2) Determining a person’s physical position in a multi-building indoor space using wifi fingerprinting. |
1) Use AWS Elastic Map Reduce (EMR) platform to collect large amounts of smart-phone preference data from the Common Crawl, then compile it into a single data matrix. 2) Use hand assesed smart phone sentiment data matrices to develop predictive models and then apply these models to the data collected. |
Marcelo Jimenez
