Toolkit to generate customized visualizations related to optical flow
PyPI page
·
Installation
·
Examples
·
Presets
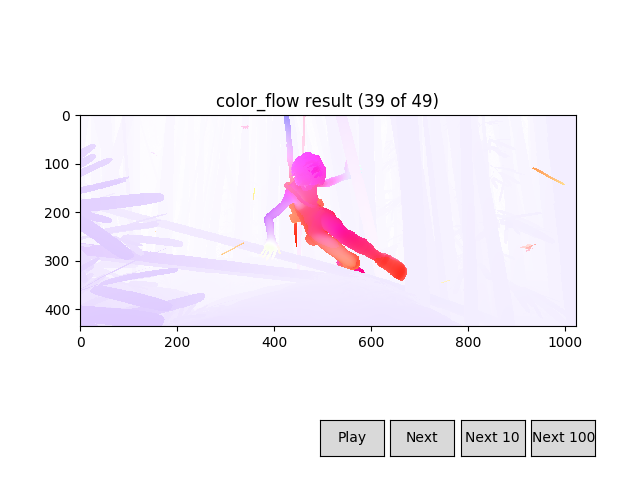 |
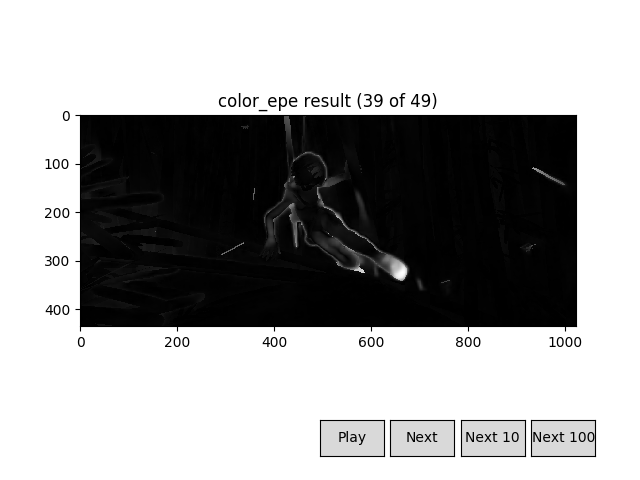 |
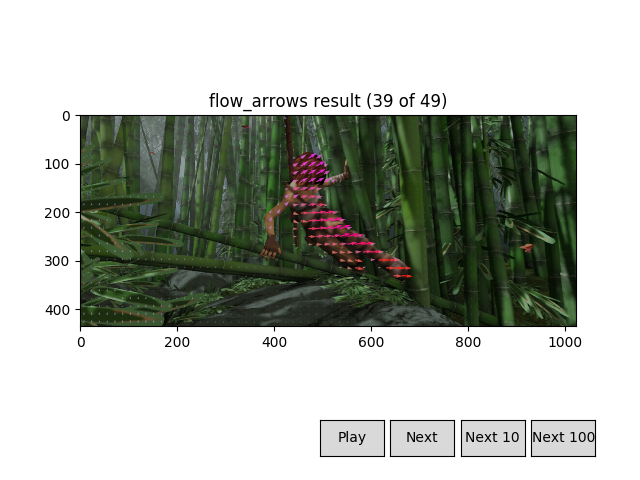 |
flowvid is a toolkit for all things related to optical flow. It comes with many visualization presets you can generate with no effort (see below), but it also allows for more complex data manipulation that doesn't have to imply generating a visualization (see examples).
flowvid is available as a PyPI package:
pip3 install flowvid
Or you can install it directly from Github:
pip3 install git+https://github.com/diegoroyo/flowvid/
or you can clone the repo:
git clone https://github.com/diegoroyo/flowvid.git
cd flowvid
scripts/local_install.sh
You might need to install the following dependencies:
pip3 install imageio imageio-ffmpeg numpy matplotlib Pillow
# or if you use the provided requirements.txt
pip3 install -r requirements.txtFlowvid is a python library for video generation, but it also contains several video presets with an user-friendly assistant:
- Usage:
python3 -m flowvid<preset>[ <config-params> | --config <config-file> ] - Presets can be listed using
python3 -m flowvid -h
Preset can be one of:
  color_flow: Convert flow data to RGB using the Middlebury representation
  color_epe: Calculate endpoint error and generate a video representation
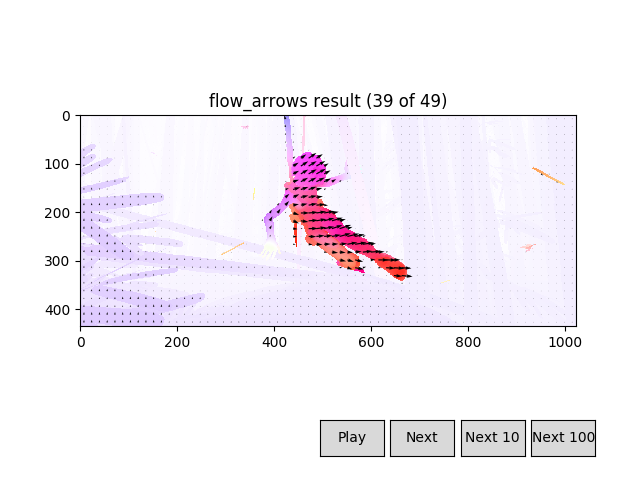
  flow_arrows: Draw arrows representing optical flow over a video
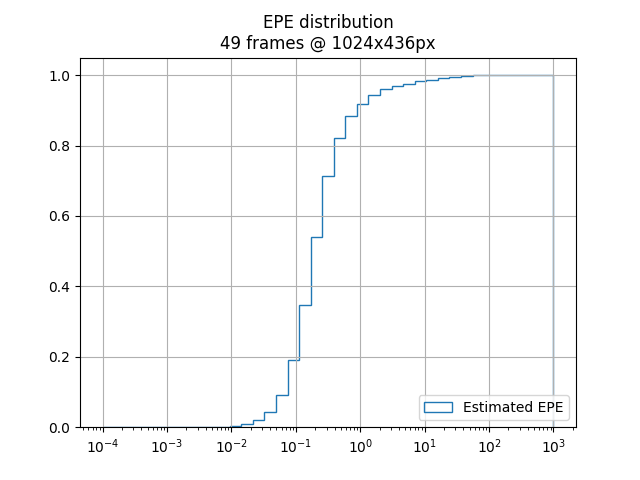
  plot_epe: Generate a pyplot plot with the EPE distribution in all frames
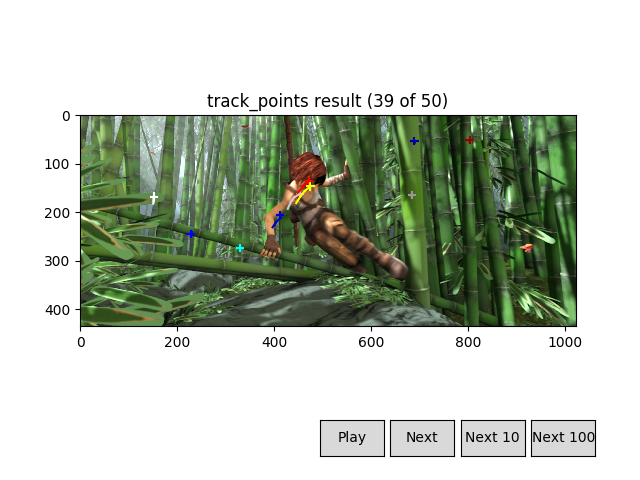
  track_points: Place points in a image and see how flow moves them
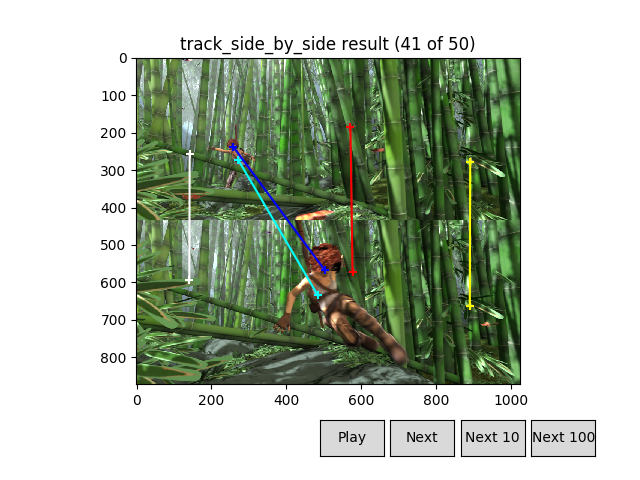
  track_side_by_side: Place points in a image and see how flow can track them
- Example: converting flow files to rgb and saving into a video
$ python3 -m flowvid color_flow

# \/ option names are shown here
[--flo-dir] Flow files directory (default: flo): path/to/flo/dir
[--norm-type] Vector normalization type (video, [frame], none): video
[--norm-clamp] Normalization clamp percentage (default: 1.0): 0.8
[--norm-gamma] Normalization gamma curve exponent (default: 1.0): 1.5
[--output-type] Output type ([video], pyplot): pyplot
[--output-framerate] Video framerate (default: 10): 10
You can specify its parameters via the command line. The following is equivalent:
# Option names can be listed with python3 -m flowvid --help
$ python3 -m flowvid color_flow
    --flo-dir path/to/flo/dir
    --norm-type video
    --norm-clamp 0.8
    --norm-gamma 1.5
    --output-type pyplot
    --output-framerate 10
Configuration can also be saved in a file so you don't have to type it always:
# Store configuration after use
$ python3 -m flowvid color_flow --flo-dir path/to/flo/dir (...)

Save configuration in a file? (y, [n]): y
Output configuration filename (default: preset_color_flow.yaml): path/to/config.yaml

Saved configuration file in path/to/config.yaml

(...)

# Load from a file
$ python3 -m flowvid color_flow --config path/to/config.yaml
Here are some examples illustrating the other presets' results:
color_epe |
plot_epe |
|---|---|
 |
 |
track_points |
track_side_by_side |
|---|---|
 |
 |
flow_arrows (1) |
flow_arrows (2) |
|---|---|
 |
 |
If you want to generate more complex or customized videos, you can easily use flowvid's tools:
- You can check the documentation and example usages here.
- You can check the source code for the given presets here.
import flowvid as fv

# Convert multiple optical flow files to their color representation,
# and save them to a video (.mp4) file.
# Similar to `color_flow` preset, without the extra options

# Read flow files data
flo_data = fv.input.flo('path/to/flo/dir')

# Normalize each file (so max flow's module is 1),
# necessary to convert to RGB
flo_data = fv.normalize_frame(flo_data)
rgb_data = fv.flow_to_rgb(flo_data)

# Output as video
out = fv.output.video(filename='output.mp4', framerate=24)
out.add_all(rgb_data)
The given code's structure and information flows (flo/rgb data) can be represented with the following nodes:
-
Logo made by Github user Aeri (see profile).
-
Flow to RGB conversion is based on C. Liu's work.
C. Liu. Beyond Pixels: Exploring New Representations and Applications for Motion Analysis. Doctoral Thesis. Massachusetts Institute of Technology. May 2009.

