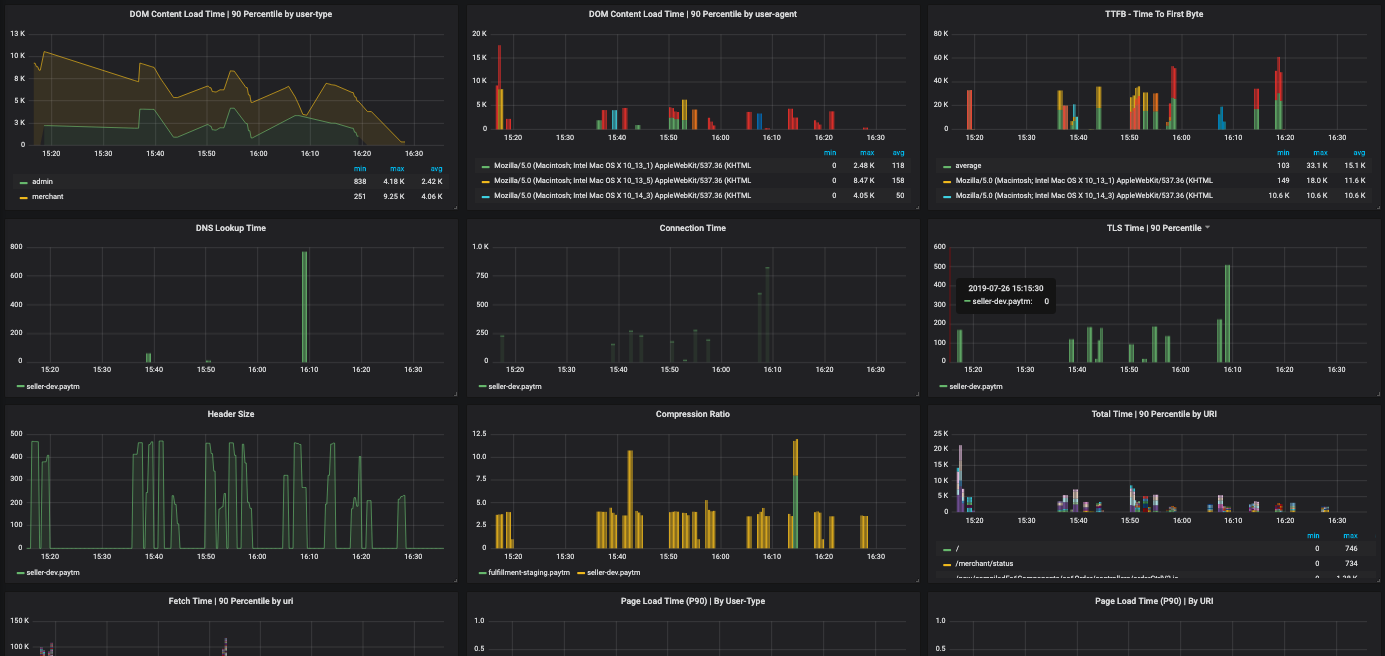
A light weighted client side library to enable RUM(Real User Monitoring) for web applications.
Using npm:
$ npm i --save rum-client-js- How will you compare how my application is performing on different browsers and their versions.
- Which resources are blocking my main thread and increasing first paint/interaction time?
- Are my resources properly encoded and compressed before sending to client?
- How to monitor application performance post deployments? Many more..
// Load the script's in the head section of the page
<script src="./path-to-script/rum-client-js/dist/rum-client.min.js"></script>
<script type="application/javascript">
    let RUMObject = new TrackPerformance({
        trackUrl: `${window.location.origin}/api/track`, // Endpoint at which collected data is sent
        batchSize: 50, // max entry batch size sent to server
        threshold: 3000, // in ms
        includeHosts: [ // consider entries from these hosts only
            'myapp.com'
        ],
        excludeHosts: [ // skip entries from these hosts (only works if includeHosts is not given)
            'fonts.googleapis.com',
            'themes.googleusercontent.com',
            'fonts.gstatic.com',
            'googletagmanager.com',
            'google-analytics.com'
        ],
        parserCb: (entry) => {
            // if you want to edit/add extra parameters to each entry
            return entry;
        },
        filterCb: (entry) => {
            // if you want to skip entry collection based on some condition
            return true;
        },
        addAdditionalData: () => {
            // if you want to add common tags for all entries
            return {
                tags: {
                    "user-agent": navigator.userAgent,
                    "app-version": "1.0.0"
                }
            };
        },
        excludeKeys: ['nextHopProtocol', 'initiatorType'] // exclude keys from each entry
    });

    // If you want to stop tracking manually, use below code
    // RUMObject.stop();
</script>Library internally compute and expose below mentioned metrics for each entry.
    1. DNS Time - entry.dnsTime
    2. Connection time - entry.connectionTime
    3. TLS time - entry.tlsTime
    4. Time to First Byte (TTFB) - entry.ttfb
    5. Fetch Time - entry.fetchTime
    6. Worker Time - entry.workerTime
    7. Total Time entry.totalTime
    8. Download Time - entry.downloadTime
    9. Header Size - entry.headerSize
    10. Compression Ratio - entry.compressionRatio
    11. DOM Content Load Time - entry.DOMContentLoadTime // For entry.entryType === "navigation"
12. Page Load Time - entry.pageLoadTime // For entry.entryType === "navigation"The collected data will be available at the configured URL (trackUrl). You can use the data points to create UI as per requirements. Below is one such implementation where I have piped the data points to a Data Source(Prometheus) and plotted the metrics against a UI(Grafana)
