-
Notifications
You must be signed in to change notification settings - Fork 2
Tutorial on UMMperfusion
To analyze (preclinical) image data with UMMPerfusion, the image data need to be converted into DICOM prior to the analysis. Visual inspection is required to check that all slices are aligned as time advances. Slices with clear motion artifacts should be removed. More robustly, data with slight movements can be recovered by coregistration images to suitable baseline image(s).
The following steps are based on the UMMPerfusion plugin [12] and the DICOM workstation OsiriX.
-
Open the dataset in the Osirix 4D-viewer
-
OsiriX will check if the data selected are a 4D data set (3D spatial plus 1D temporal), however, sometimes this internal check fails. Therefore, an intermediate step might be necessary to load the data into the UMMPerfusion plugin. To do so, select the series in the database window. Press the Alt-Key and click the 2D-viewer’s icon at the same time. A window will open. Select/click on the 4D-viewer button, the series will appear within the 4D viewer, although it was not designed for it initially.
-
Start the plugin via the Osirix plugin menu
Plugins → image filter → UMMPerfusion
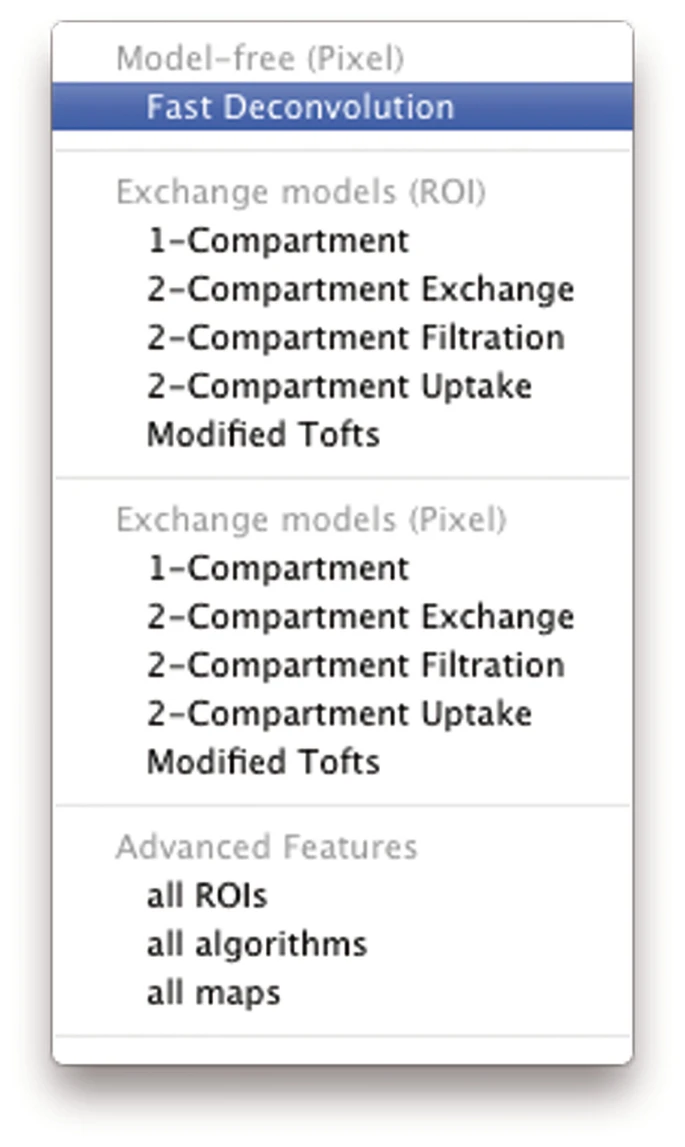
- Select algorithm from the tool bar
-
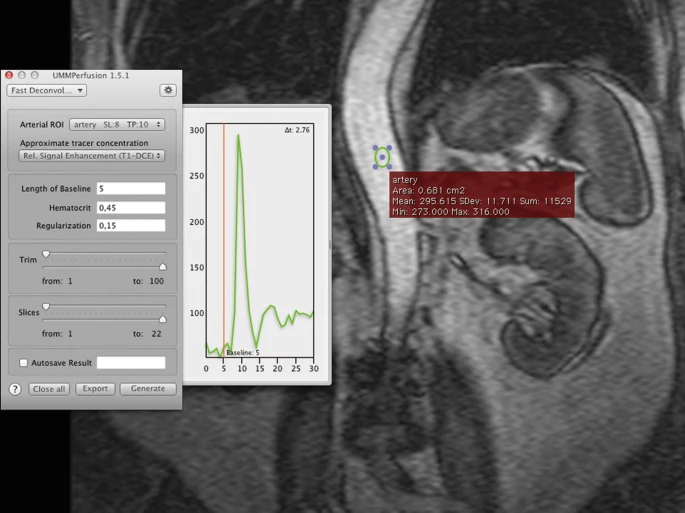
Place a ROI on a clearly visible artery in order to receive an arterial input function.
-
For ensuring correct results all algorithms require an arterial input function (AIF). This function is defined by using the Osirix ROI-tool and by placing/designating a “region of interest” (ROI ) on the abdominal artery. An oval is used as a standard, however all ROI-tools offered by Osirix are supported by UMMPerfusion.
Upon placing a ROI , a chart will appear on the right-hand side of the plugin window, depicting the arterial input function. The aif-color corresponds to the current ROI border color, whereas the vertical line, the base line will always be in red. When a ROI is created, it will be attached to the popup-menu. If several ROIs have been created within this dataset, the desired ROI has to be assigned to its determined position. If only one pixel shall be the source of the AIF, the ROI-Brush- Tool with the size of 1px is to be used in order to specify the smallest ROI possible.
-
Make sure that the desired ROI is selected in the popup menu called “Arterial.”
-
A good ROI selection can be recognized by a large peak on the chart to the right of the plugin-window.
-
Drag the baseline to a desired position or simply enter the value in the respective text field.
-
The length of baseline represents the number of images during a certain period of time that are used for signal normalization. For attaining correct results, the baseline should be chosen in a way that the tracer is not yet visible at that point of time. The easiest way to set the baseline is to drag the baseline with the mouse to its desired timeframe in the AIF-chart. The value can alternatively be inserted into the baseline textfield.
-
Set limits to the relevant scope by using the trim-sliders if necessary.
-
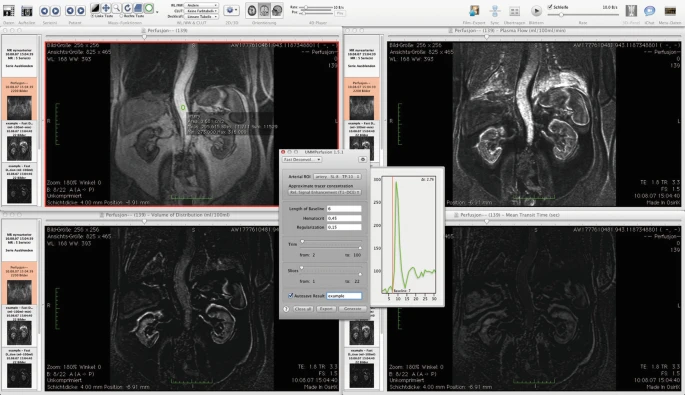
Before hitting the generate-button, there is the opportunity to activate the autosave-checkbox to automatically save the results and to generate a report.
-
The calculation begins after using the generate-button.
-
As a result, three new views/viewers are created in which the calculated data are presented. Each viewer shows one parametric map calculated by the deconvolution approach: blood flow (perfusion) in ml/100 ml/min, the blood volume (ml/100 ml) and the mean transit time (s).
- If the autosave function has not been activated before using the generate button, it is still possible to save the results as well as the report after the calculation. In this case, use the export button next to the generate-button.


