-
Notifications
You must be signed in to change notification settings - Fork 113
3_visualization
For more details of the commands, use -h option to see the usage.
LiCSBAS_disp_img.py -i image_file -p par_file [-c cmap] [--cmin float] [--cmax float]
    [--auto_crange float]  [--cycle float] [--bigendian] [--png pngname] [--kmz kmzname]

 -i  Input image file in float32 or uint8
 -p  Parameter file containing width and length (e.g., EQA.dem_par or mli.par)
 -c  Colormap name (see below for available colormap)
     - https://matplotlib.org/tutorials/colors/colormaps.html
     - http://www.fabiocrameri.ch/colourmaps.php
     - insar
     (Default: SCM.roma_r, reverse of SCM.roma)
 --cmin|cmax    Min|max values of color (Default: None (auto))
 --auto_crange  % of color range used for automatic determinatin (Default: 99)
 --cycle        Value*2pi/cycle only if cyclic cmap (i.e., insar or SCM.*O*)
                (Default: 3 (6pi/cycle))
 --bigendian    If input file is in big endian
 --png          Save png (pdf etc also available) instead of displaying
 --kmz          Save kmz (need EQA.dem_par for -p option)
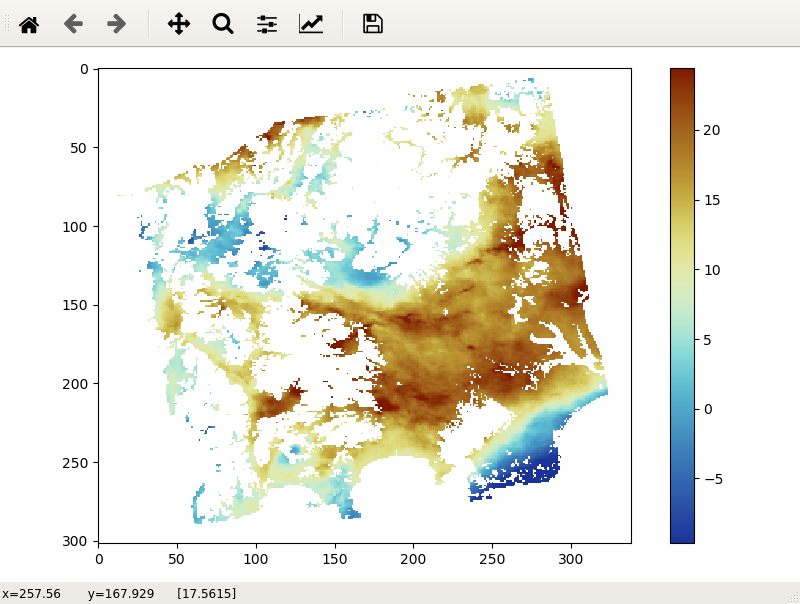
This script displays an image file.


LiCSBAS_plot_ts.py [-i cum[_filt].h5] [--i2 cum*.h5] [-m yyyymmdd] [-d results_dir]
    [-u U.geo] [-r x1:x2/y1:y2] [--ref_geo lon1/lon2/lat1/lat2] [-p x/y]
    [--p_geo lon/lat] [-c cmap] [--nomask] [--vmin float] [--vmax float]
    [--auto_crange float] [--dmin float] [--dmax float] [--ylen float]

 -i    Input cum hdf5 file (Default: ./cum_filt.h5 or ./cum.h5)
 --i2  Input 2nd cum hdf5 file
       (Default: cum.h5 if -i cum_filt.h5, otherwise none)
 -m    Master (reference) date for time-seires (Default: first date)
 -d    Directory containing noise indices (e.g., mask, coh_avg, etc.)
       (Default: "results" at the same dir as cum[_filt].h5)
 -u    Input U.geo file to show incidence angle (Default: ../GEOCml*/U.geo)
 -r    Initial reference area (Default: same as info/*ref.txt)
       0 for x2/y2 means all. (i.e., 0:0/0:0 means whole area).
 --ref_geo   Initial reference area in geographical coordinates.
 -p    Initial selected point for time series plot (Default: ref point)
 --p_geo     Initial selected point in geogrphical coordinates.
 -c    Color map for velocity and cumulative displacement
       - https://matplotlib.org/tutorials/colors/colormaps.html
       - http://www.fabiocrameri.ch/colourmaps.php
       (Default: SCM.roma_r, reverse of SCM.roma)
 --nomask     Not use mask (Default: use mask)
 --vmin|vmax  Min|max values of color for velocity map (Default: auto)
 --dmin|dmax  Min|max values of color for cumulative displacement map
              (Default: auto)
 --auto_crange  Percentage of color range used for automatic determinatin
              (Default: 99 %)
 --ylen       Y Length of time series plot in mm (Default: auto)
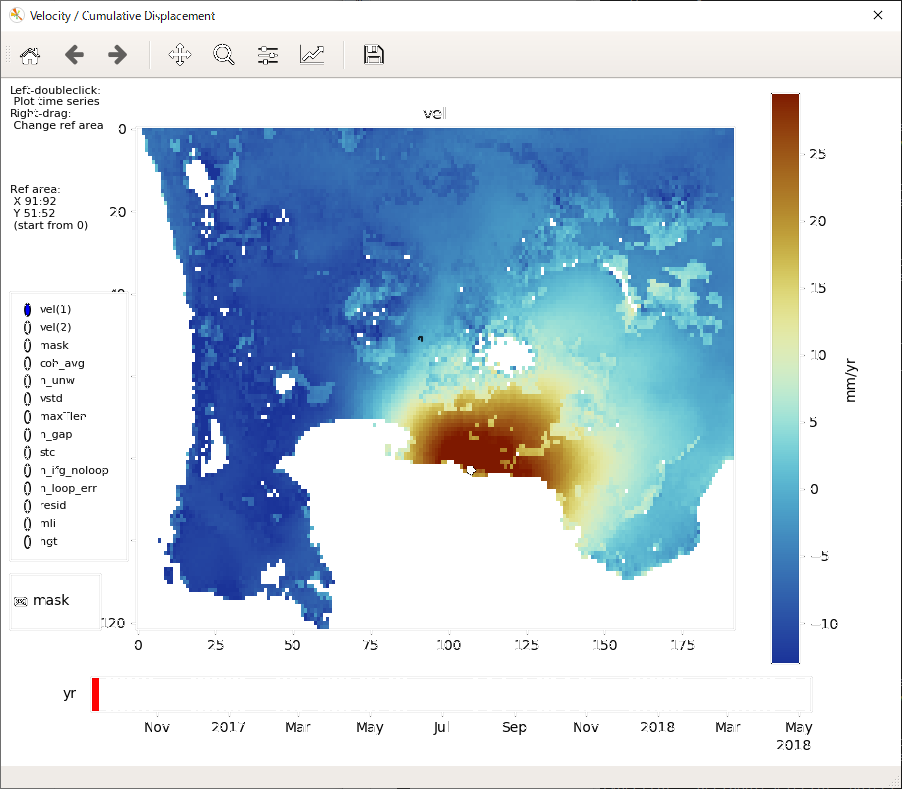
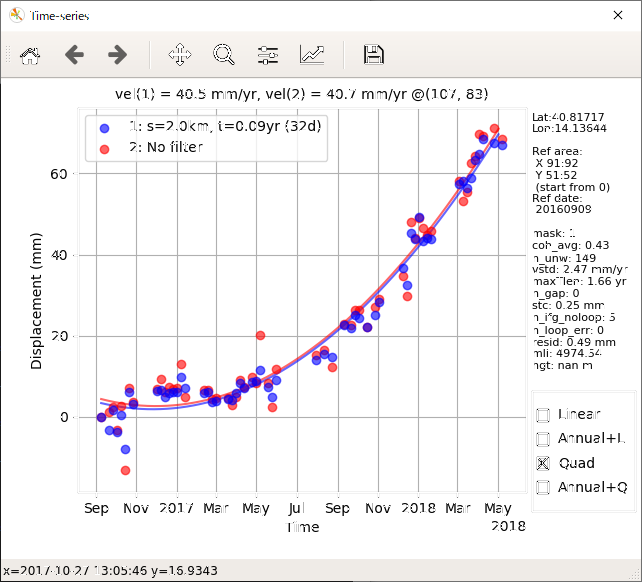
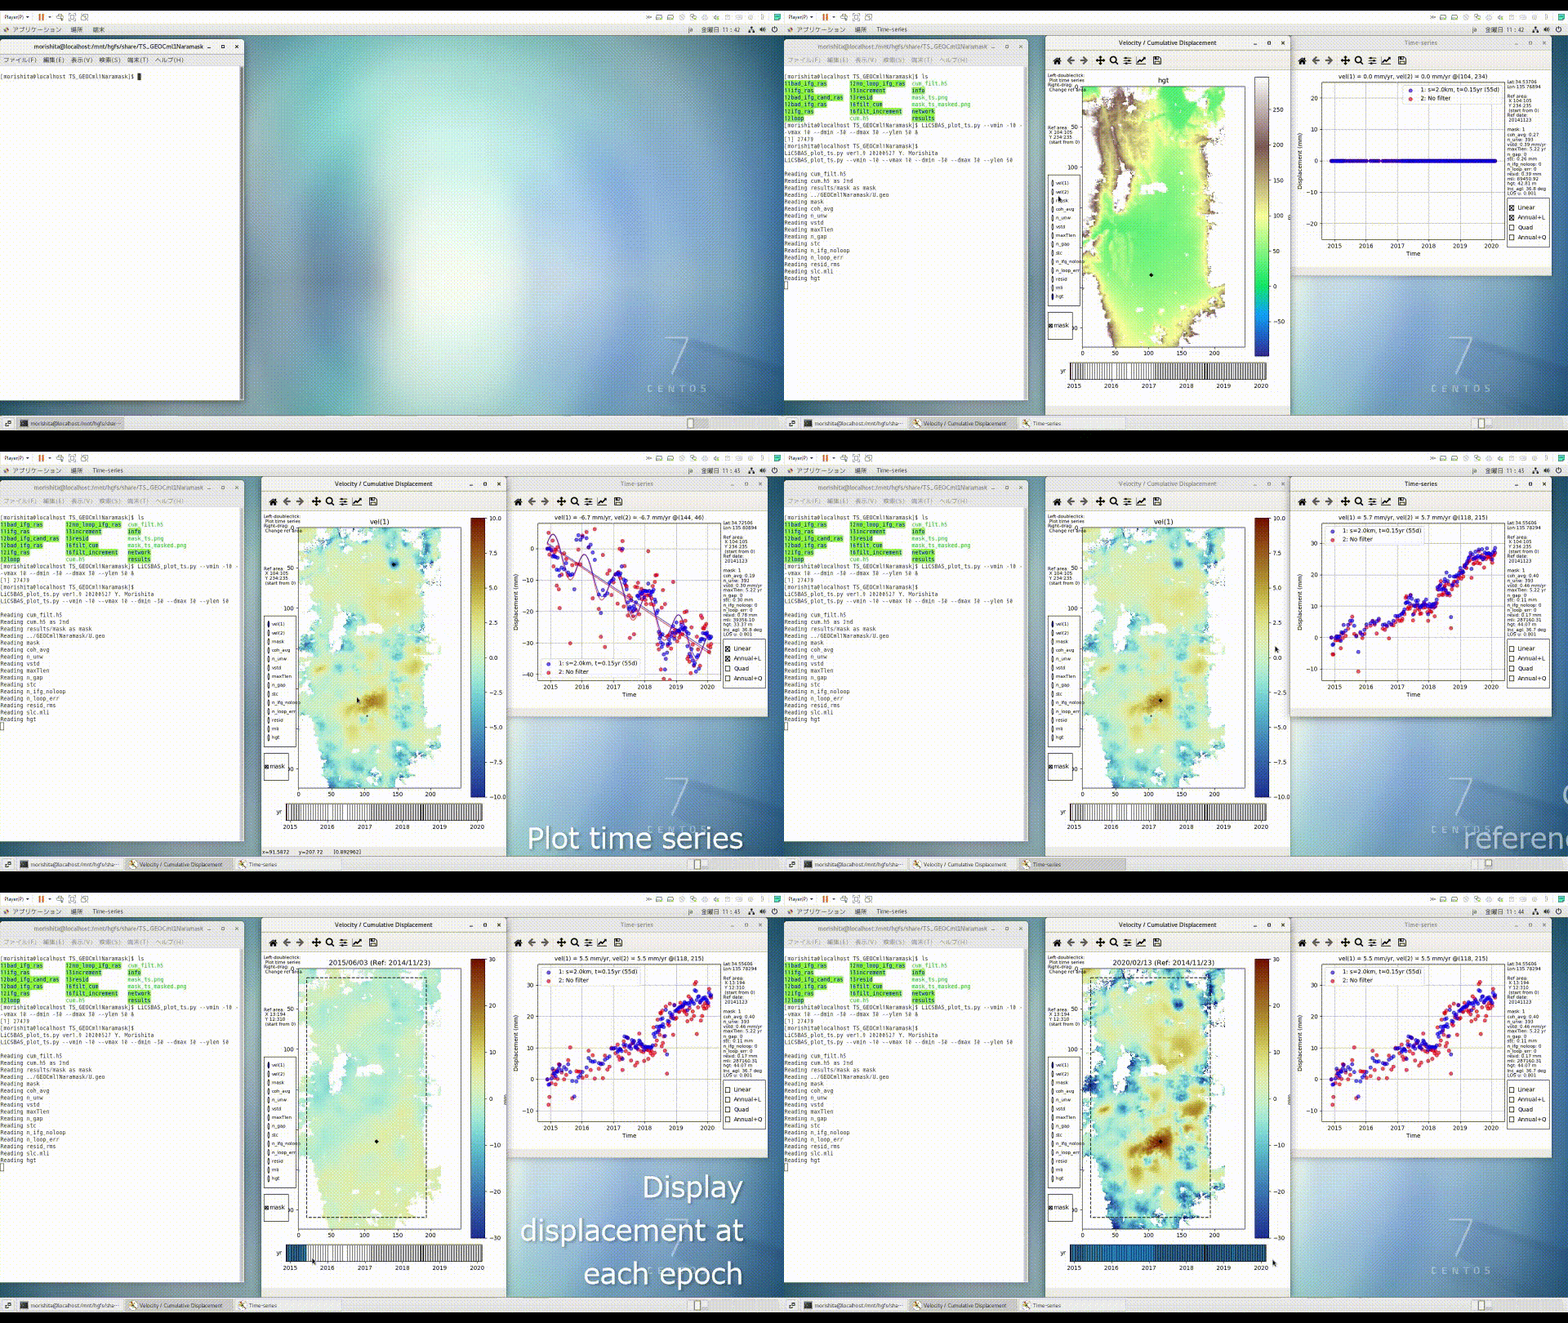
This script displays the velocity, cumulative displacement, and noise indices, and plots the time series of displacement. You can interactively change the displayed image/area and select a point for the time series plot. The reference area can also be changed by right dragging.


Demonstration Video (High resolution mp4, 20MB)
LiCSBAS_profile.py -i infile -p dempar [-r x1,y1/x2,y2] [-g lon1,lat1/lon2,lat2] [-o outfile] [--bigendian] [--nodisplay]

 -i  Input file (float, little endian)
 -p  Dem parameter file (EQA.dem_par)
 -r  Point locations in xy coordinates
 -g  Point locations in geographical coordinates
 -o  Output text file (Default: profile.txt)
     Format: lat lon x y distance value (x/y start from 0)
 --bigendian  If input file is in big endian
 --nodisplay  Not display quick look images

 Note: either -r or -g must be specified.
This script gets a profile data between two points specified in geographical coordinates or xy coordinates from a float file. A quick look image is displayed and a text file and kml file are output.

LiCSBAS_plot_network.py -i ifg_list -b bperp_list [-o outpngfile] [-r bad_ifg_list] [--not_plot_bad]

 -i  Text file of ifg list (format: yyymmdd_yyyymmdd)
 -b  Text file of bperp list (format: yyyymmdd yyyymmdd bperp dt)
 -o  Output image file (Default: netowrk.png)
     Available file formats: png, ps, pdf, or svg
     (see manual for matplotlib.pyplot.savefig)
 -r  Text file of bad ifg list to be plotted with red lines (format: yyymmdd_yyyymmdd)
 --not_plot_bad  Not plot bad ifgs with red lines
This script creates a png file (or in other formats) of SB network. A Gap of the network are denoted by a black vertical line if a gap exist. Bad ifgs can be denoted by red lines.
