-
Notifications
You must be signed in to change notification settings - Fork 113
3_visualization
Yu Morishita edited this page Sep 12, 2019
·
22 revisions
For more details of the commands, use -h option to see the usage.
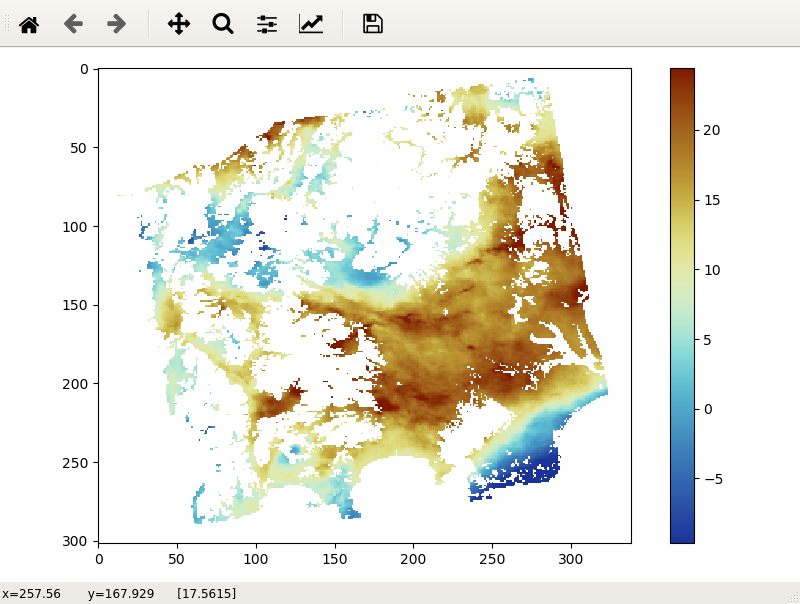
LiCSBAS_disp_img.py -i image_file -p par_file [-c SCM5.roma_r] [--cmin None] [--cmax None] [--auto_crange 99] [--cycle 3] [--bigendian] [--png [pngname]]This script displays an image file (only in float format).


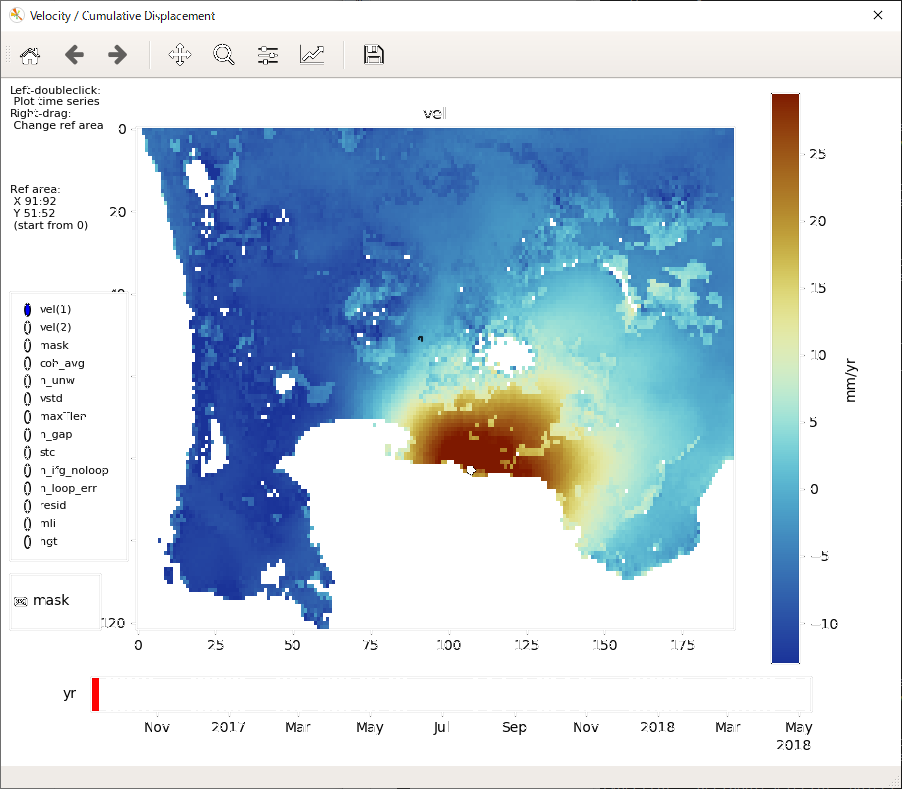
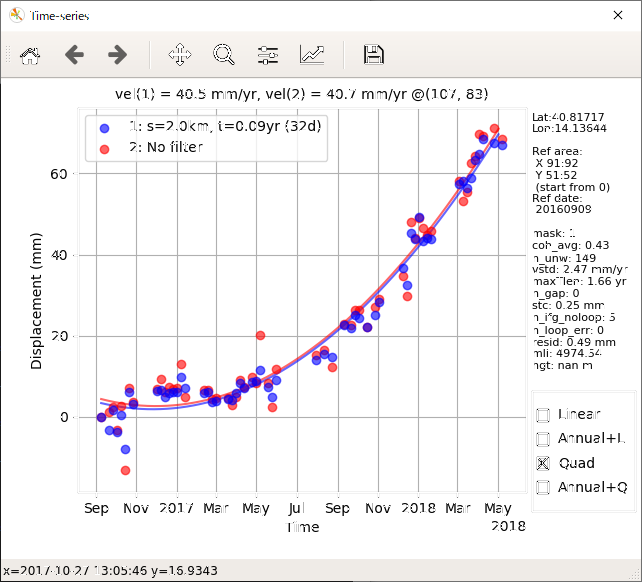
LiCSBAS_plot_ts.py [-i cum[_filt].h5] [--i2 cum*.h5] [-d results_dir] [-m yyyymmdd] [-r x1:x2/y1:y2] [--nomask] [--cmap cmap] [--vmin vmin] [--vmax vmax] [--auto_crange auto_crange] [--dmin dmin] [--dmax dmax] [--ylen ylen]This script displays the velocity, cumulative displacement, and noise indices, and plots the time series of displacement. You can interactively change the displayed image/area and select a point for the time series plot. The reference area can also be changed by right dragging.

