Below are the major components deployed with the Kubecost Helm chart, excluding certain Enterprise components such as durable storage:
- Kubecost Cost-Analyzer Pod
a. Frontend -- runs Nginx and handles routing to Kubecost backend + Prometheus/Grafana
b. Cost-model -- provides cost allocation calculations and metrics, both reads and writes to Prometheus - Prometheus
a. Prometheus server -- time-series data store for cost & health metrics
b. Kube-state-metrics -- provides Kubernetes API metrics, e.g. resource requests [Optional]
c. Node-exporter -- provides metrics for reserved instance recommendations, various Kubecost Grafana dashboards, and cluster health alerts [Optional]
d. Pushgateway -- provides the ability for users to push new metrics to Prometheus [Optional]
e. Alertmanager -- used for custom alerts [Optional] - Network costs -- used for determining network egress costs [Optional] - Learn more
- Grafana -- provides supporting dashboards for Kubecost product [Optional]
Today, the core Kubecost product can be run with just components 1 and 2a.
See an overview of core components in this diagram:
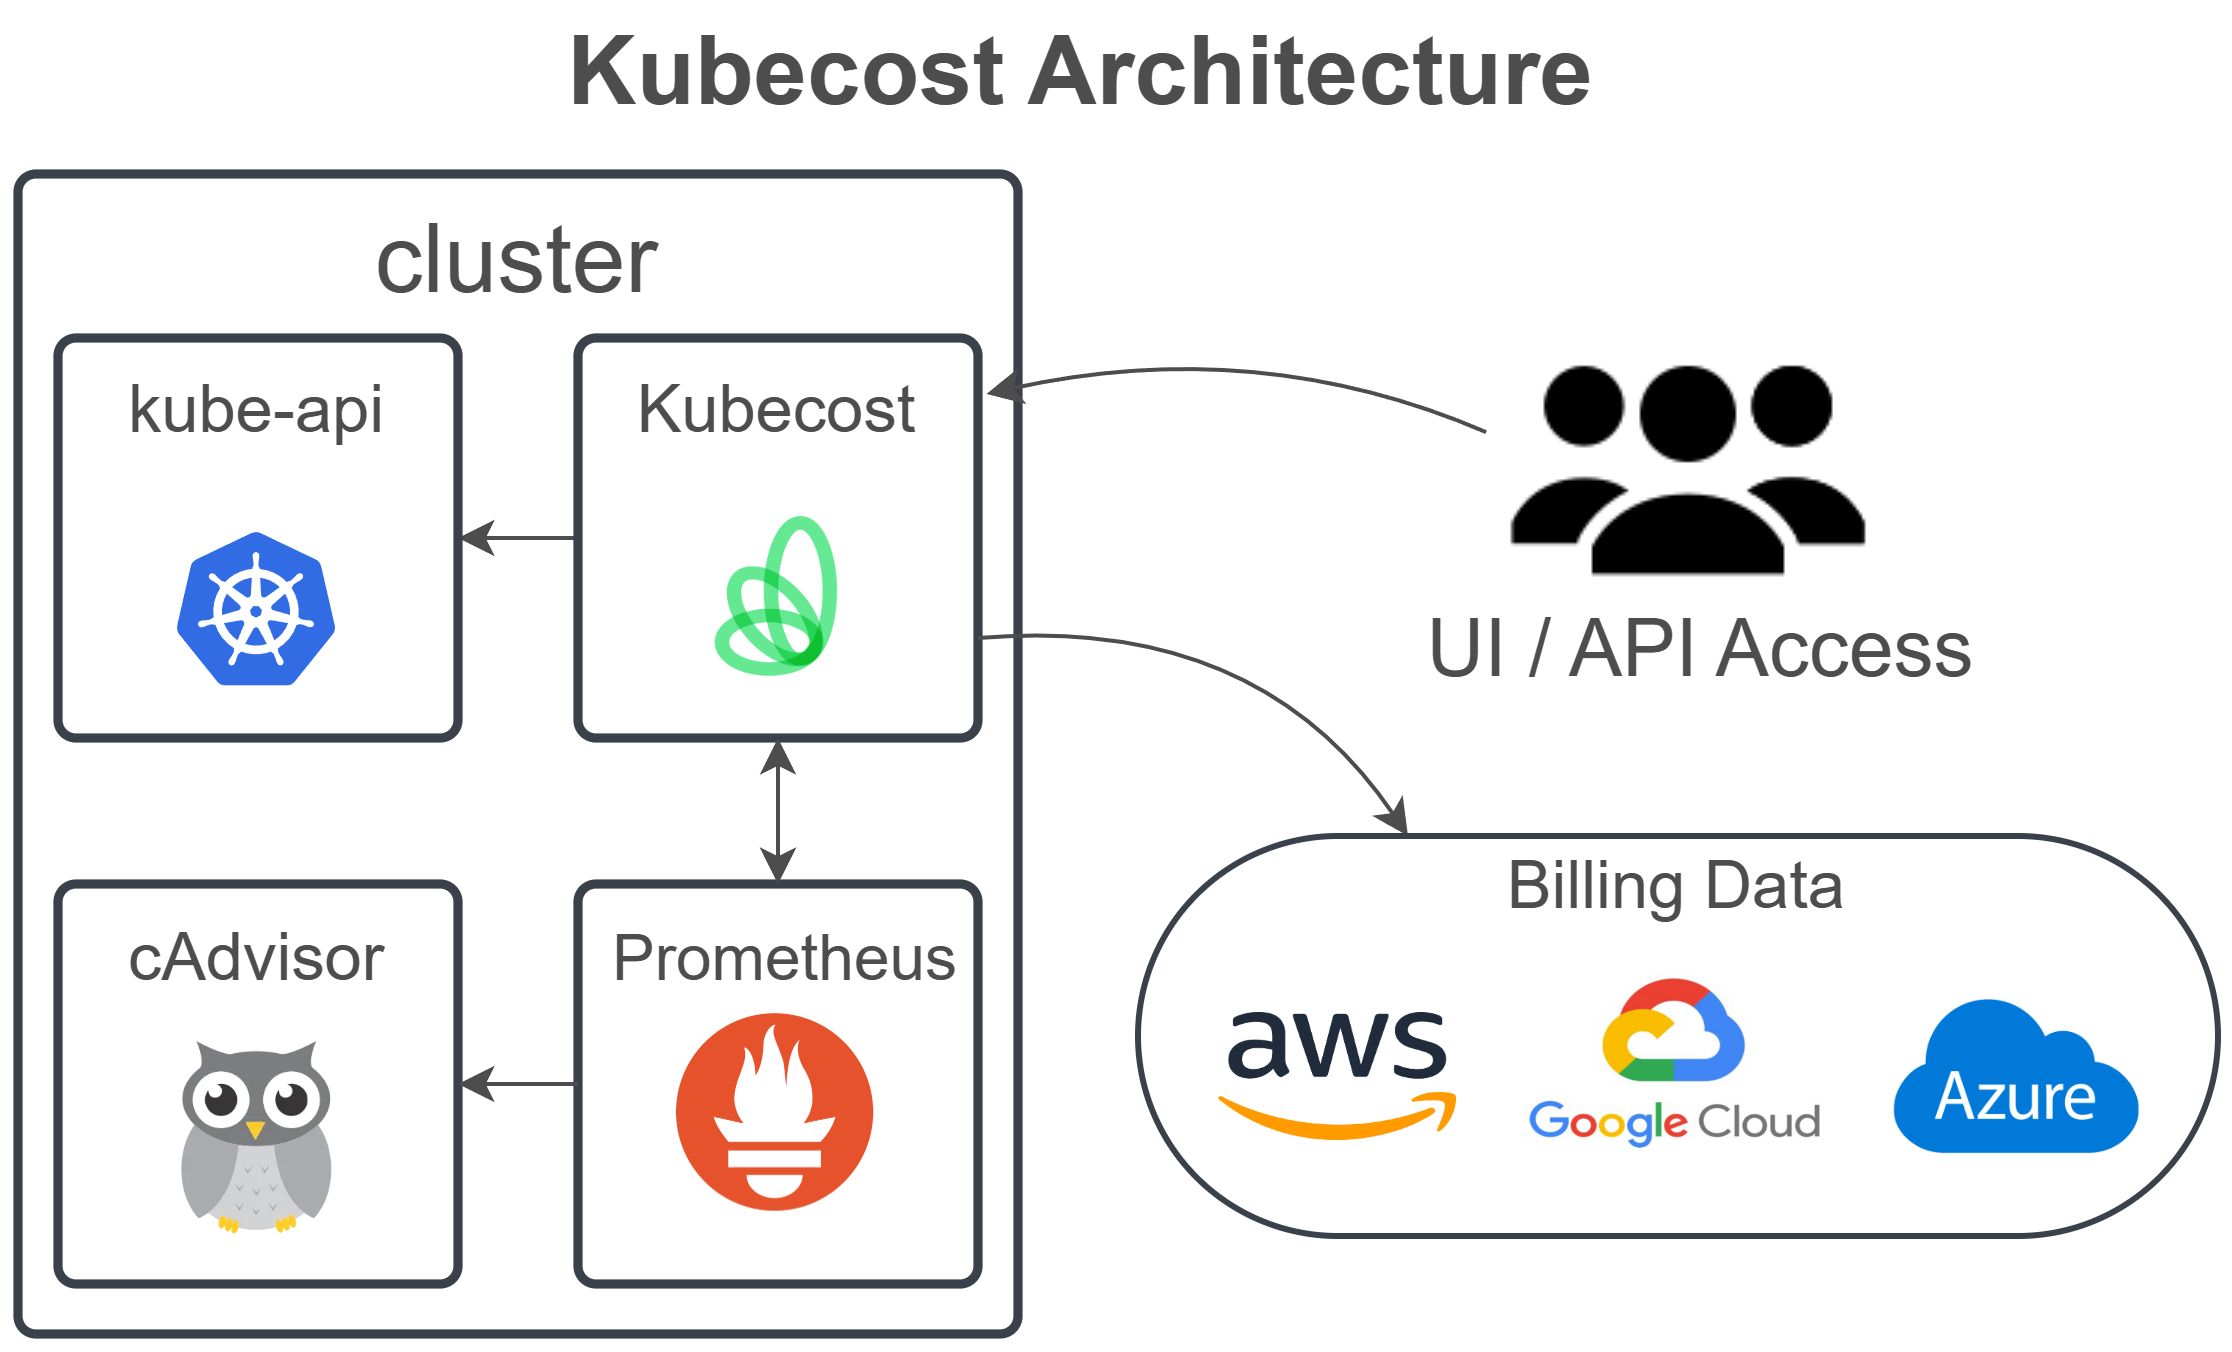
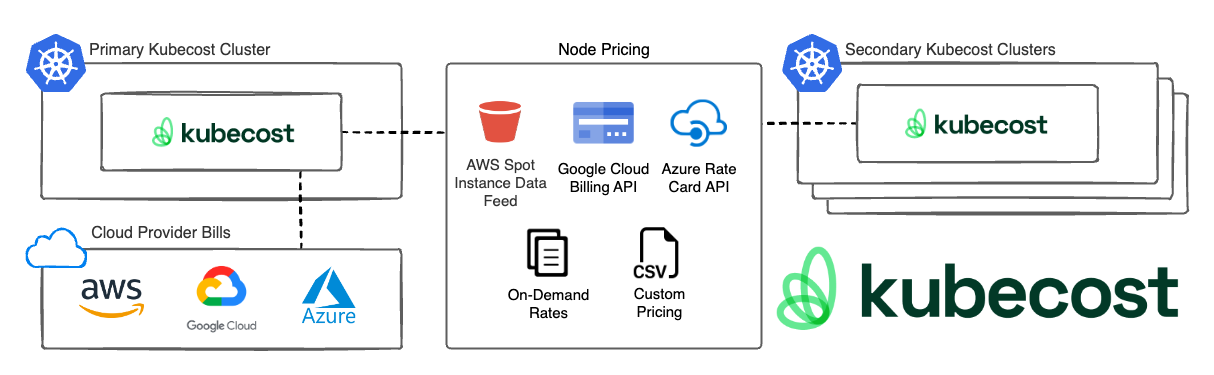
Kubecost interacts with provider pricing in a few different ways.
- onDemand Rates (AWS, Azure, GCP, and Custom Pricing CSV)
- Negotiated Rates (Azure, GCP, and Custom Pricing CSV)
- Spot Data Feed (AWS)
- Cloud Provider Billing for Reconciliation and Out-of-Cluster Spend
In an Enterprise federated setup, only the Primary Kubecost Cluster needs access to the Cloud Provider Billing.
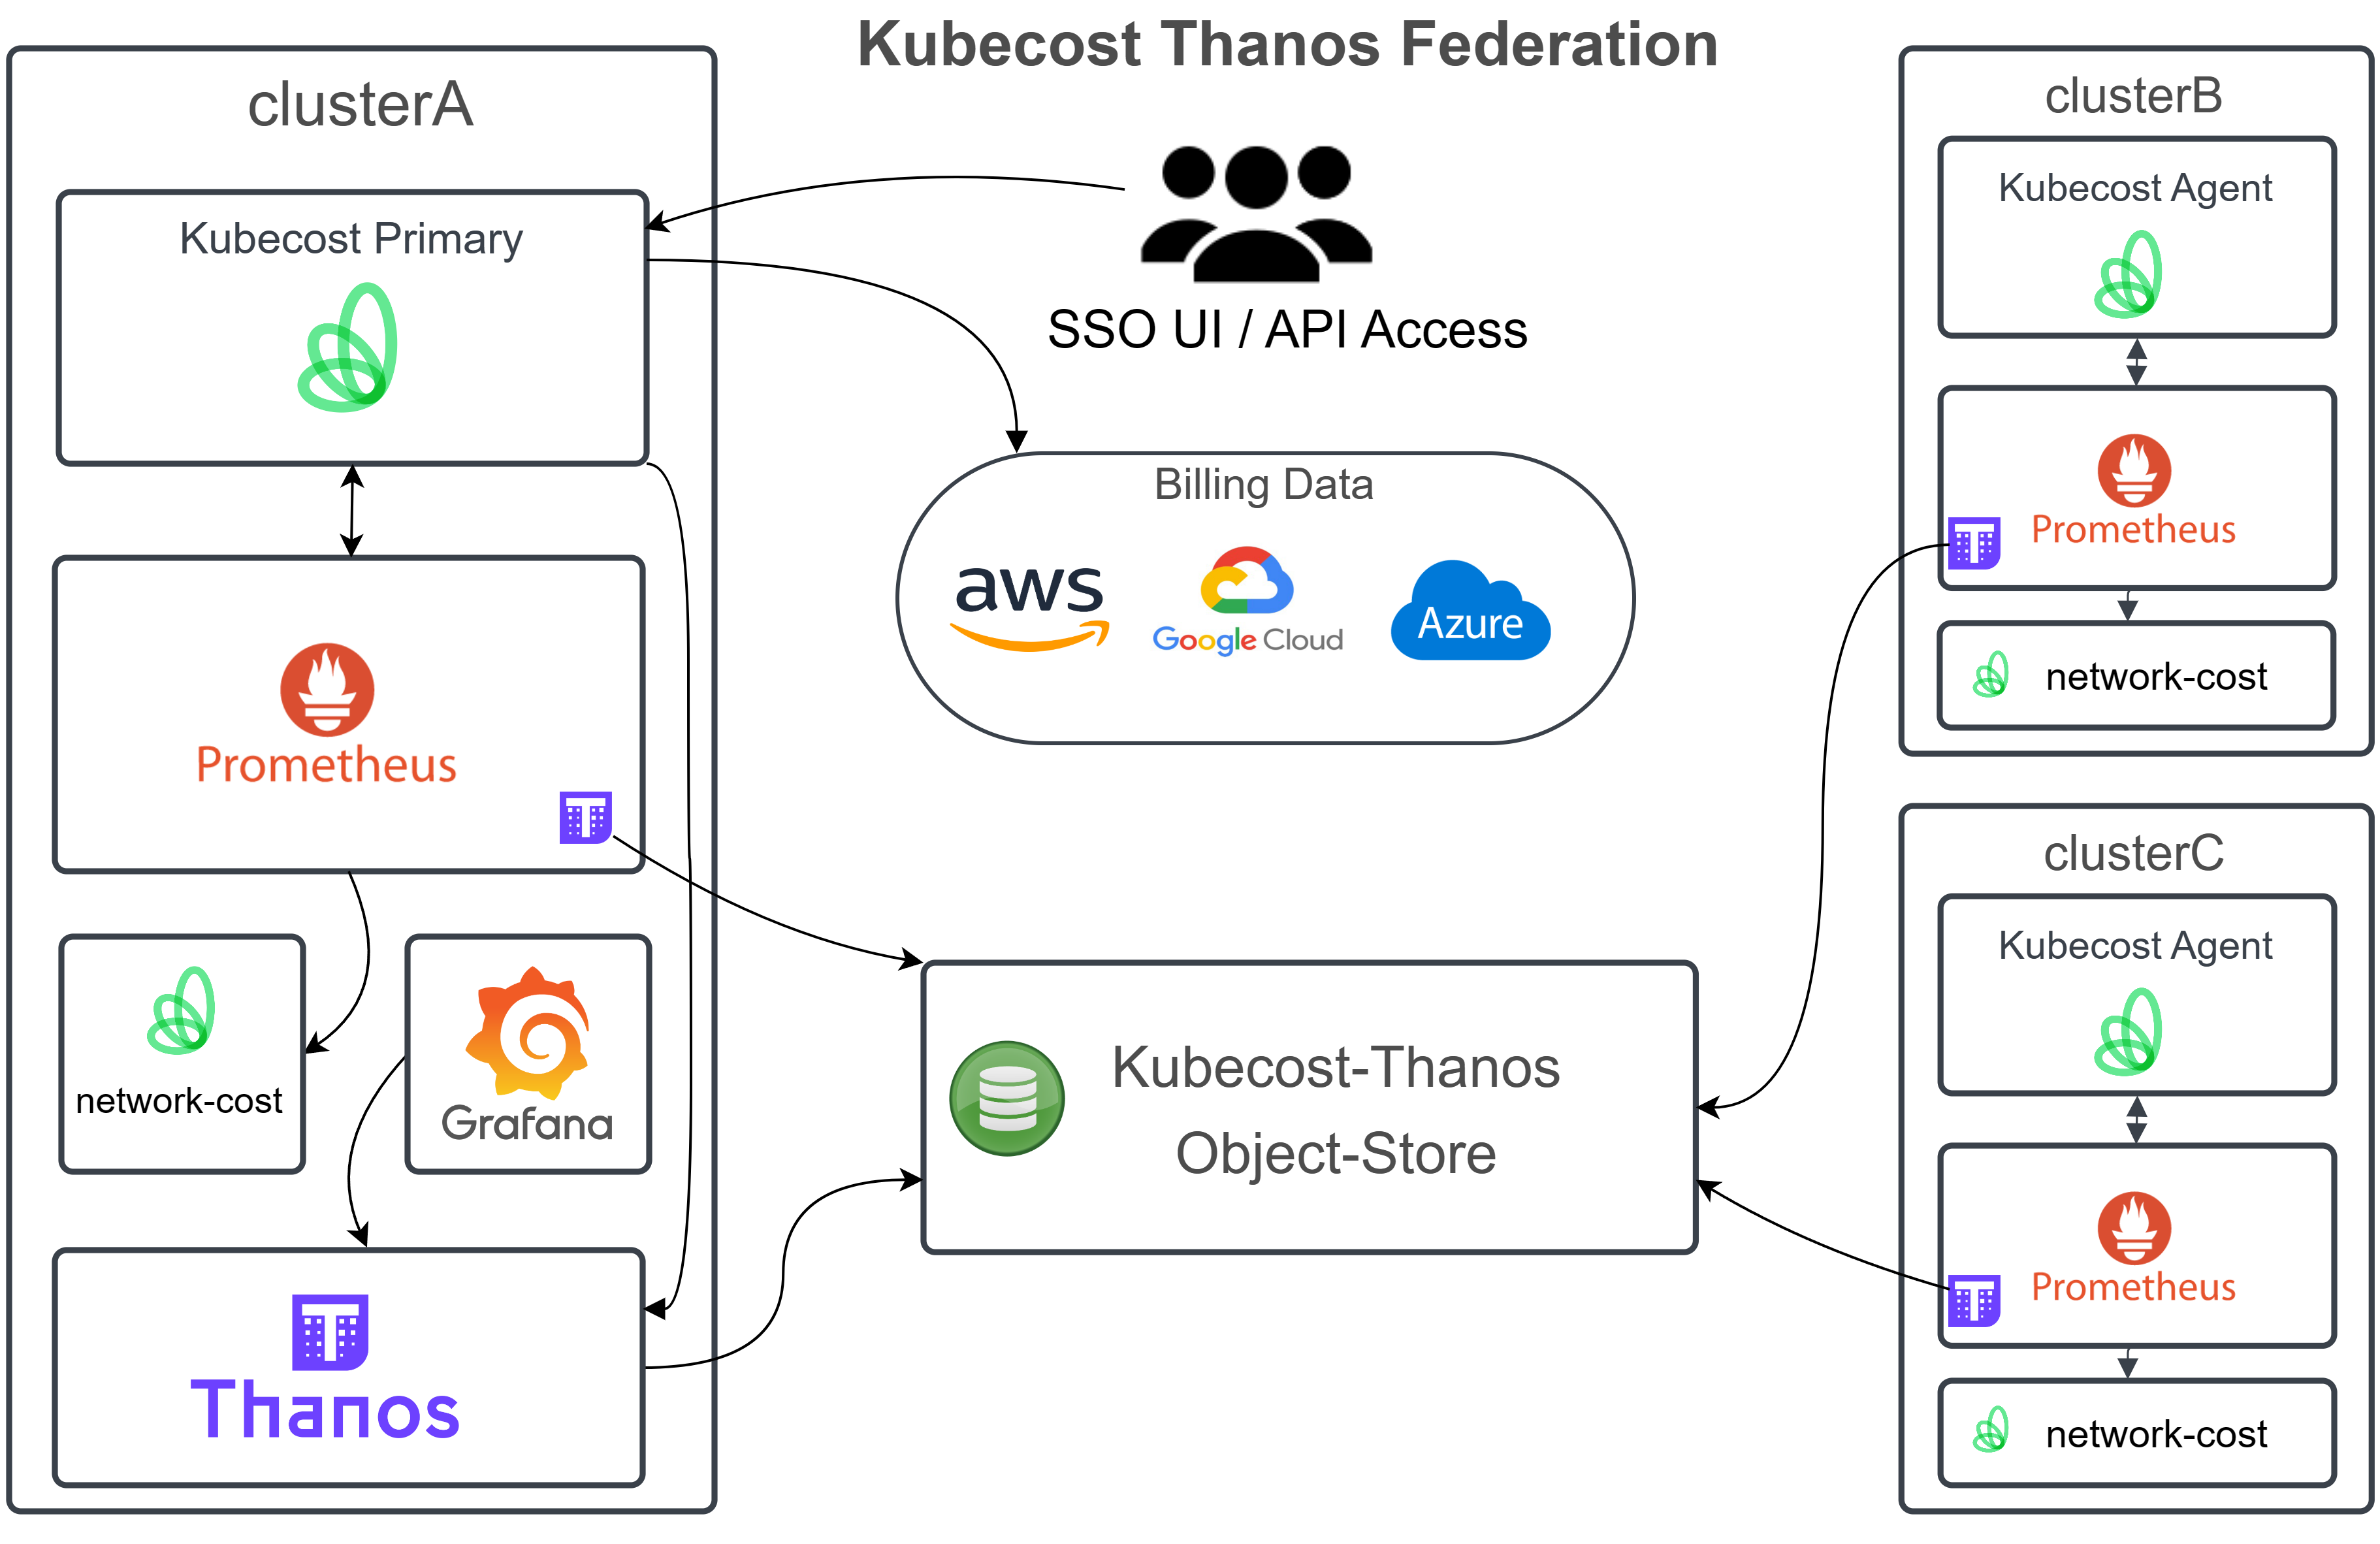
The most common implementation of durable storage in the Kubecost application is with Thanos. Below is a high-level reference for the required components. More information on each Thanos component can be found here.