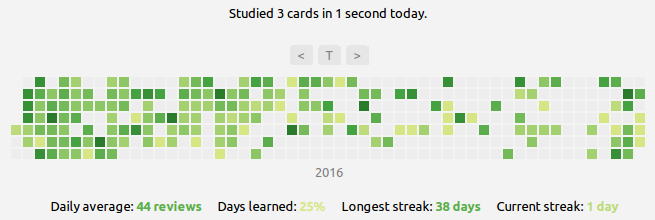
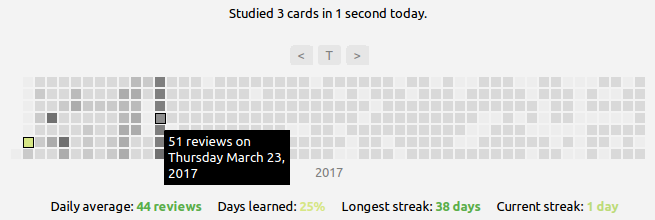
Adds a heatmap graph to Anki's main window which visualizes past and future card review activity, similar to the contribution view on GitHub. Information on the current streak is displayed alongside the heatmap. Clicking on an item shows the cards reviewed or due on that day.
IMPORTANT: You can now install Review Heatmap by simply copying the add-on code below into Anki (under Tools → Add-ons → Get Add-ons). You no longer need to download anything manually!
- Color-coded summary of review activity: Hues of green for past reviews, shades of grey for pending reviews
- Additional stats: Review streaks, daily averages, and days learned
- Interactive controls: Clicking on a day will draw up the corresponding cards in the browser
- Highly configurable: 5 different color schemes, 2 different calendar modes, etc.
The use of this add-on is documented in the official Wiki and the YouTube videos below:


(Make sure to enable closed-captions for comments on the demonstrated features)
Copyright © 2016-2022 Aristotelis P. (Glutanimate)
Inspired by GitHub's contribution calendar and Forecast graph on Overview page by Steve AW. Ships with the following javascript libraries:
- d3.js (v3.5.17), (c) Mike Bostock, BSD license
- cal-heatmap (v3.6.2), (c) Wan Qi Chen, MIT license
Licensed under the GNU AGPLv3, extended by a number of additional terms. This program is distributed in the hope that it will be useful, but WITHOUT ANY WARRANTY. For more information on the license please see the LICENSE file accompanying this add-on. The source code is available on 