Faster center transition for dark-centered diverging maps #50
Comments
|
hmm, to me, the second plot you posted with So, I have a return question first: Are ALL non-zero values in this plot important to clearly visualize? |
|
hmm, to me, the second plot you posted with So, I have a return question first: Are ALL non-zero values in this plot important to clearly visualize? |
Describe the colors you would like
I want 'bwr' only with black in the middle, i.e.. I want "dark mode bwr": Blue on one side, red on the other, black in the middle, but for a fairly narrow range in the middle.
I notice that all the light-centered diverging maps appear as if there is a "rapid" transition around the central value, whereas for the darker maps the central dark colors cover a might wider proportion of the colormap.
My collaborator hates all the white in this image and asked for a "dark mode", so I'm working on that.

'redshift' has too much of the middle of the color range as near-black:
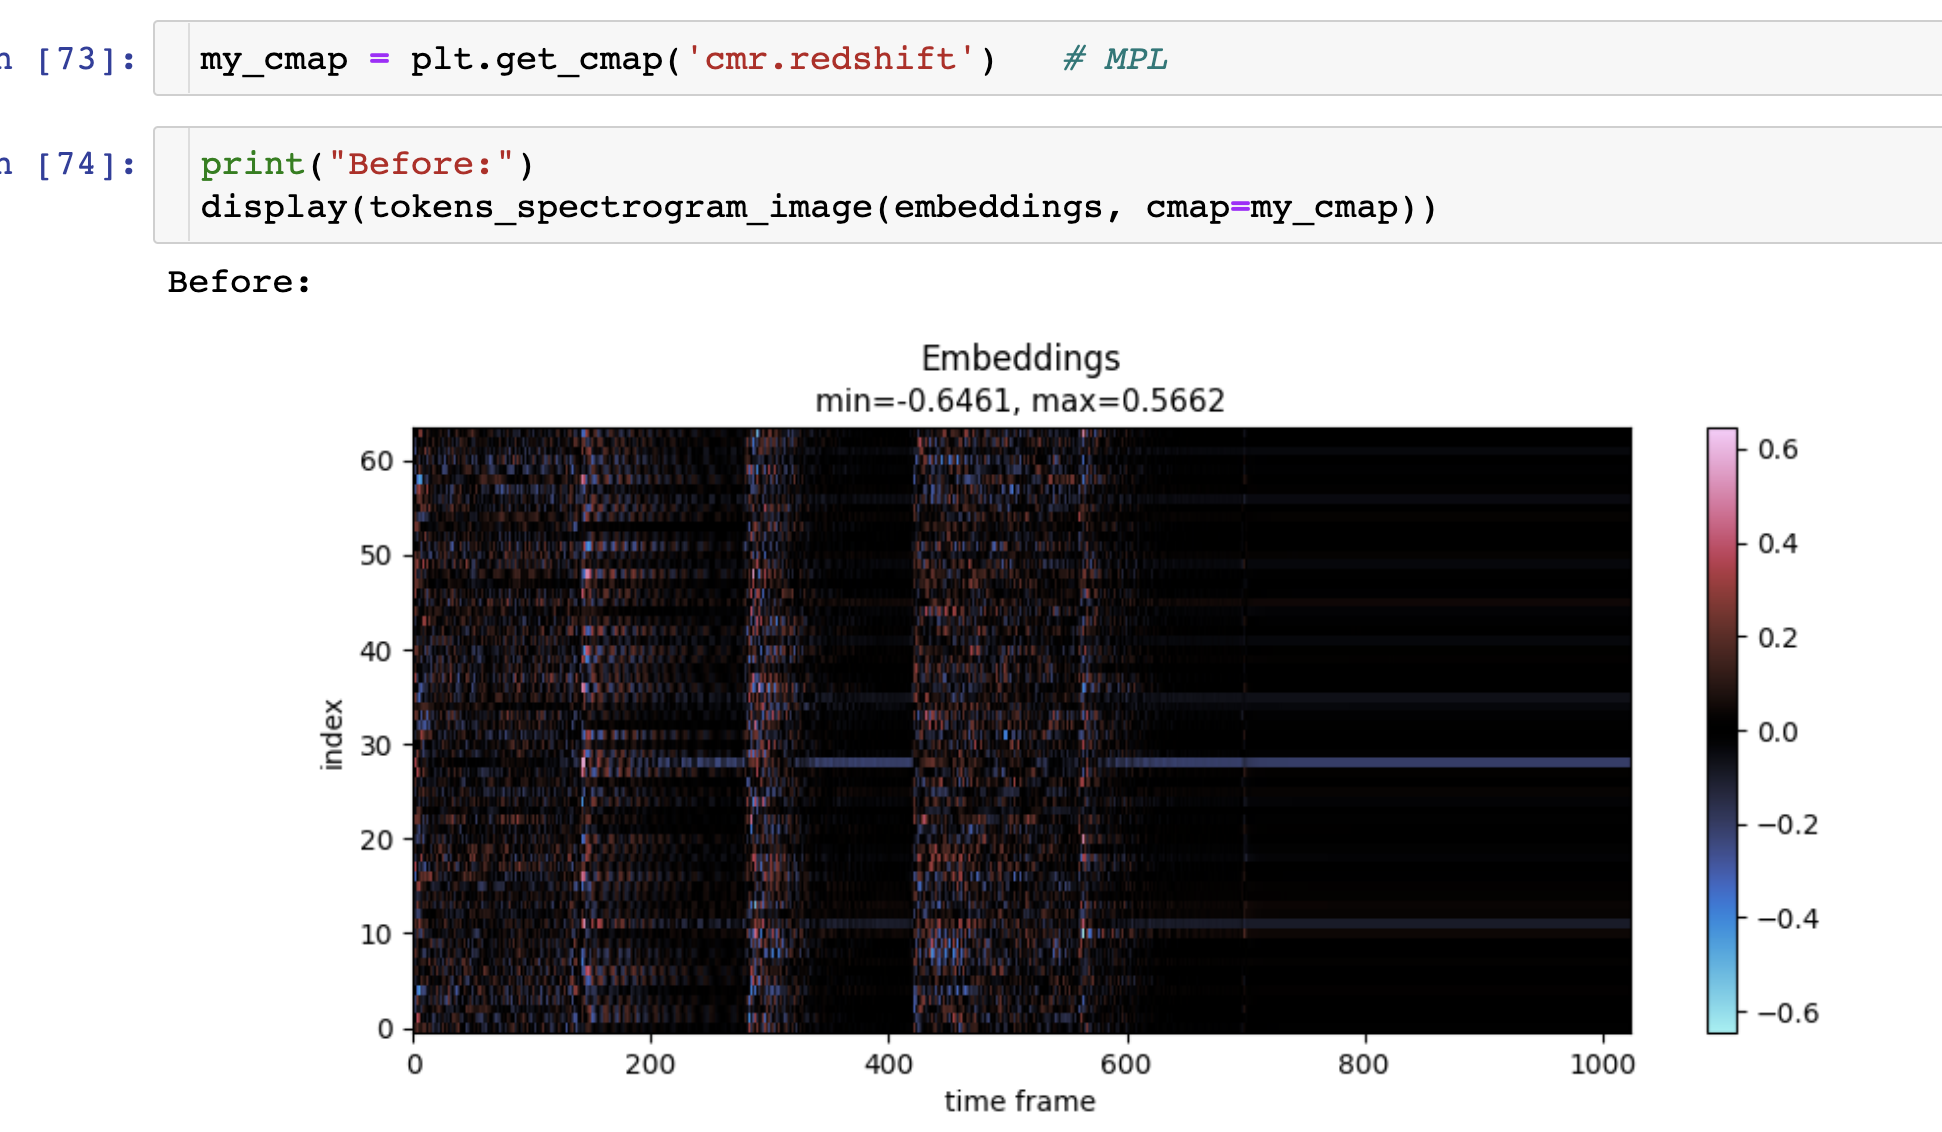
I want the black to cover a more narrow range in the middle.
'guppy' seems to provide the most rapid transition of the dark-centered diverging colormaps, but I don't want purple in the middle. Most of my plot ends up looking purple (see screenshot below), whereas I'd rather have it mostly dark.

Describe the colormap type
diverging
Describe any extra properties
I'm not sure how one gets colorblind-friendliness in a diverging map, but if possible, that'd be great!
Is your colormap request related to a specific application? Please describe.
Sure, see
tokens_spectrogram_image()in myaeioulibrary.I want to easily see at a glance the distribution of positive, negative, and "small" (near zero) values in a 2D array.
Additional context
screenshots above
The text was updated successfully, but these errors were encountered: